

Class 8: Maths Chapter 19 solutions. Complete Class 8 Maths Chapter 19 Notes.
Contents
ML Aggarwal Solutions for Class 8 Maths Chapter 19- Data Handling
ML Aggarwal 8th Maths Chapter 19, Class 8 Maths Chapter 19 solutions
Exercise 19.1
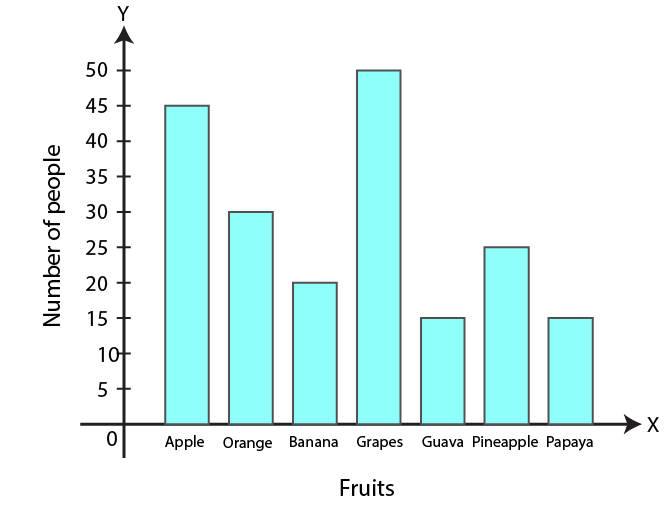
1. The result of a survey of 200 people about their favourite fruit is given below:
| Fruit | Apple | Orange | Banana | Grapes | Guava | Pineapple | Papaya |
| Number of people | 45 | 30 | 20 | 50 | 15 | 25 | 15 |
Represent the above data by a bar graph.
Solution:
| Fruit | Apple | Orange | Banana | Grapes | Guava | Pineapple | Papaya |
| Number of people | 45 | 30 | 20 | 50 | 15 | 25 | 15 |
The bar graph is shown below
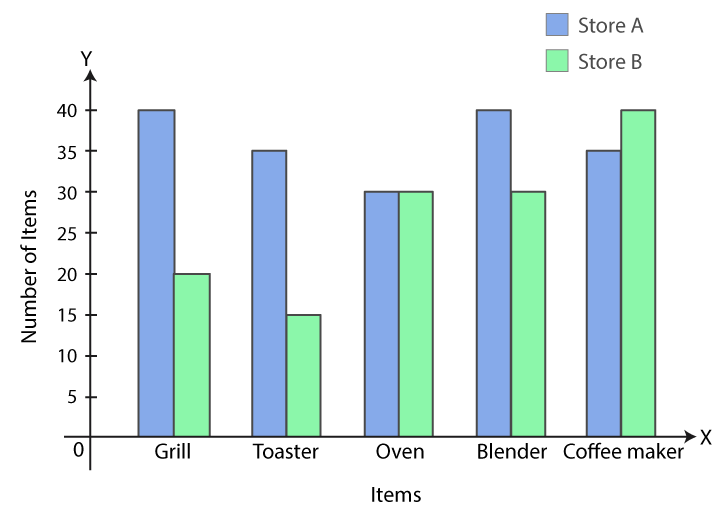
2. Mr Khurana has two kitchen appliance stores. He compares the sales of two stores during a month and recovered as given below
| Item | Number of items sold | |
| Store A | Store B | |
| GrillToasterOvenBlenderCoffee maker | 4035304035 | 2015303040 |
Represent the above data by a double bar graph.
Solution:
| Item | Number of items sold | |
| Store A | Store B | |
| GrillToasterOvenBlenderCoffee maker | 4035304035 | 2015303040 |
The double bar graph of the given data is shown below
3. The number of goals scored by a football team in different matches is given below:
3, 1, 0, 4, 6, 0, 0, 1, 1, 2, 2, 3, 5, 1, 2, 0, 1, 0, 2, 3, 9, 2, 0, 1, 0, 1, 4, 1, 0, 2, 5, 1, 2, 2, 3, 1, 0, 0, 0, 1, 1, 0, 2, 3, 0, 1, 5, 2, 0
Make a frequency distribution table using tally marks
Solution:
Frequency table for the given data is as follows:
| Number of goals scored | Tally Marks | Frequency of matches |
| 01234569 |     ||||||| ||||||| | 14131052311 |
| Total | 49 |
4. Given below a bar graph:
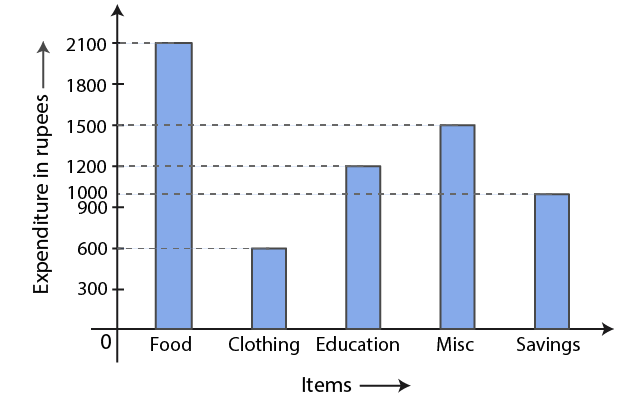
Read the bar graph carefully and answer the following questions:
(i) What is the information given by the bar graph?
(ii) On which item the expenditure is maximum?
(iii) On which item the expenditure is minimum?
(iv) State whether true or false:
Expenditure on education is twice the expenditure on clothing
Solution:
(i) Representation of the expenditure of monthly salary on different heads is the information given in the bar graph
(ii) The expenditure on food is maximum
(iii) The expenditure on clothing is minimum
(iv) Yes, the expenditure on education is twice the expenditure on clothing
5. Given below a double bar graph
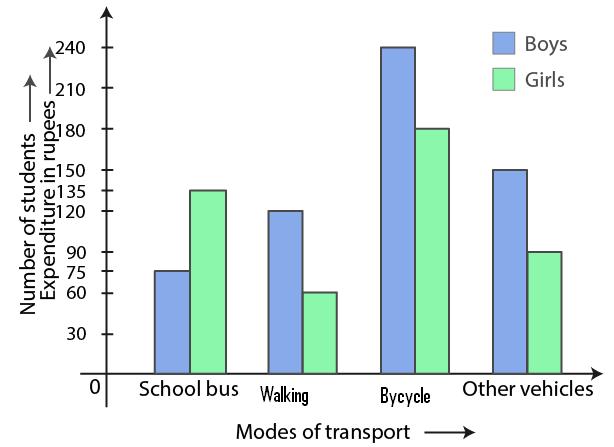
Read the double bar graph carefully and answer the following questions:
(i) What is the information given by the double graph?
(ii) Which mode of transport girls using more than the boys?
(iii) Which mode of transport boys using the most?
(iv) In which mode of transport number of girls is half the number of boys?
Solution:
From the double bar graph:
(i) The bar graph represents number of boys and girls, going to school using different modes of transport
(ii) The mode of transport, girls using more than the boys is school bus
(iii) The mode of transport, boys using the most is bicycle
(iv) The mode of transport, number of girls is half the number of boys is walking
6. Using class intervals 0-5, 5-10, construct the frequency distribution table for the following data:
13, 6, 12, 9, 11, 14, 2, 8, 18, 16, 9, 13, 17, 11, 19, 6, 7, 12, 22, 21, 18, 1, 8, 12, 18
Solution:
The frequency table is as follows:
| Class Intervals | Tally Marks | Frequency |
| 0-55-1010-1515-2020-25 | ||   || || | 27862 |
| Total | 25 |
7. Given below are the marks secured by 35 students in a surprise test:
41, 32, 35, 21, 11, 47, 42, 00, 05, 18, 25, 24, 29, 38, 30, 04, 14, 24, 34, 44, 48, 33, 36, 38, 41, 48, 08, 34, 39, 11, 13, 27, 26, 43, 03.
Taking class intervals 0-10, 10-20 ……. Construct frequency distribution table. Find the number of students obtaining below 20 marks.
Solution:
The frequency table of the given data is shown below:
| Class | Tally Marks | Frequency |
| 0-1010-2020-3030-4040-50 |      | 557108 |
| Total | 35 |
Number of students obtaining below 20 marks = 5 + 5
= 10
Hence, 10 students are getting below 20 marks
8. The electricity bills (in ?) of 40 houses in a locality are given below:
78, 87, 81, 52, 59, 65, 101, 108, 115, 95, 98, 65, 62, 121, 128, 63, 76, 84, 89, 91, 65, 101, 95, 81, 87, 105, 129, 92, 75, 105, 78, 72, 107, 116, 127, 100, 80, 82, 61, 118. Construct a grouped frequency distribution table of class size 10.
Solution:
The frequency distribution table for the given data is as follows:
| Class Intervals(Electricity bill in Rs) | Tally Marks | Frequency(Number of houses) |
| 50-6060-7070-8080-9090-100100-110110-120120-130 | ||     ||||||| ||||||| | 26585734 |
| Total | 40 |
9. Draw a histogram for the frequency table made for data in Question 8, and answer the following questions:
(i) Which group has the maximum number of houses?
(ii) How many houses pay less than Rs 100?
(iii) How many houses pay Rs 100 or more?
Solution:
Histogram of the given data in Question 8 is as follows:
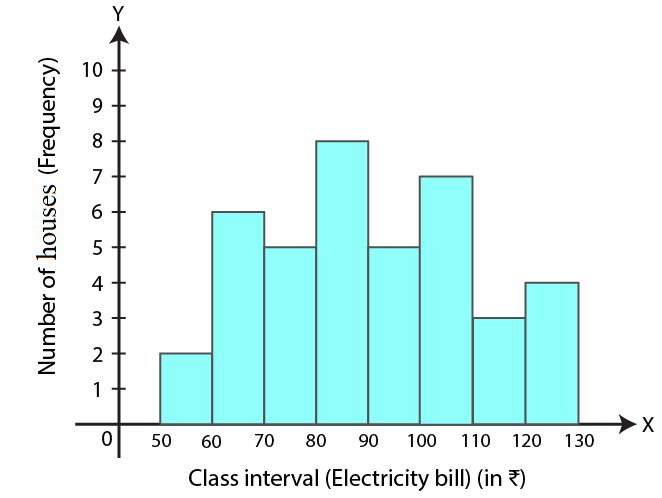
(i) Group 80-90 has maximum number of house
(ii) Number of houses who pay less than Rs 100 = 2 + 6 + 5 + 8 + 5
= 26
Hence, 26 houses pay less than Rs 100
(iii) Number of houses who pay Rs 100 or more = 7 + 3 + 4
= 14
Hence, 14 houses pay Rs 100 or more
10. The weights of 29 patients in a hospital were recorded as follows:
| Weight (in kg) | 50-55 | 55-60 | 60-65 | 65-70 | 70-75 | 75-80 |
| Number of patients | 7 | 4 | 4 | 9 | 2 | 3 |
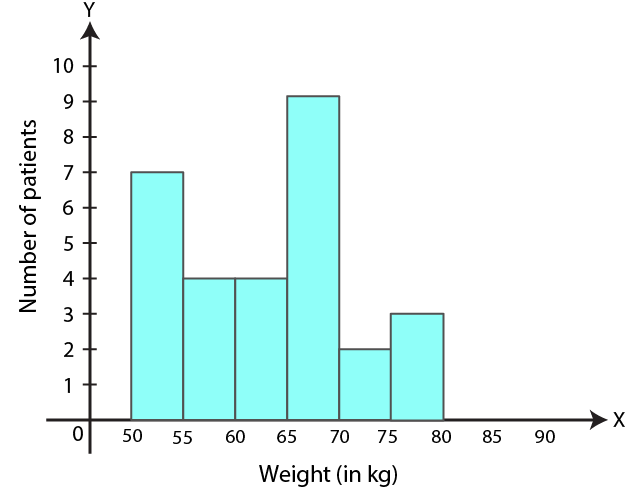
Draw a histogram to represent this data visually
Solution:
| Weight (in kg) | 50-55 | 55-60 | 60-65 | 65-70 | 70-75 | 75-80 |
| Number of patients | 7 | 4 | 4 | 9 | 2 | 3 |
The histogram for the given data is shown below:
11. In a study of diabetic patients, the following data was obtained:
| Age (in years) | 10-20 | 20-30 | 30-40 | 40-50 | 50-60 | 60-70 | 70-80 |
| Number of patients | 3 | 8 | 30 | 36 | 27 | 15 | 6 |
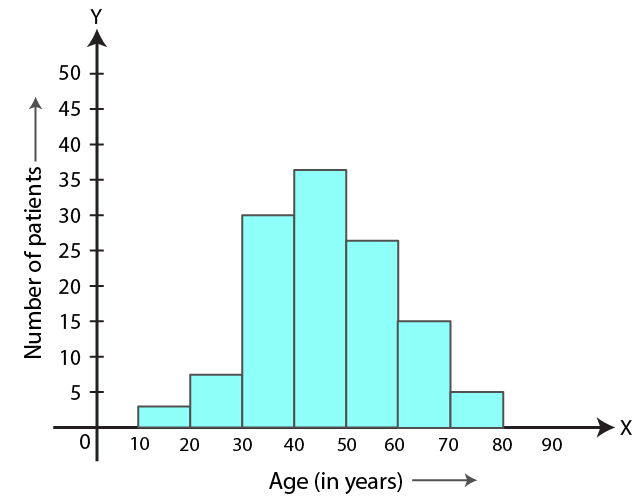
Represent the above data by a histogram
Solution:
| Age (in years) | 10-20 | 20-30 | 30-40 | 40-50 | 50-60 | 60-70 | 70-80 |
| Number of patients | 3 | 8 | 30 | 36 | 27 | 15 | 6 |
The histogram representing the above given data is as follows:
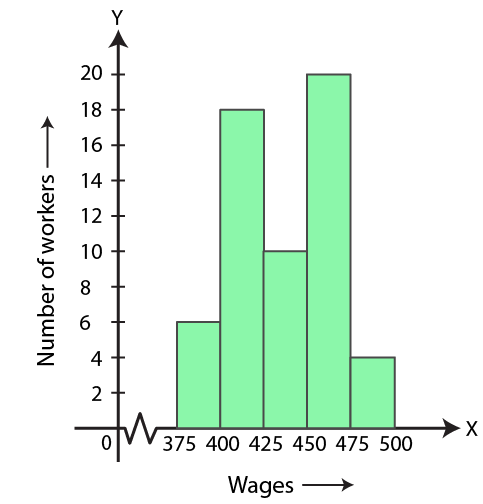
12. The histogram showing the weekly wages (in Rs) of workers in a factory is given alongside:
Answer the following:
(i) What is the frequency of class 400-425?
(ii) What is the class having a minimum frequency?
(iii) How many workers get more than Rs 425?
(iv) How many workers get less than Rs 475?
(v) Number of workers whose weekly wages are more than or equal to Rs 400 but less than Rs 450
Solution:
The weekly wages of workers in a factory is shown in the given histogram:
(i) The frequency of class 400-425 is 18
(ii) The class having the minimum frequency is 475-500
(iii) 34 workers are getting more than Rs 425
(iv) 54 workers are getting less than Rs 475
(v) Number of workers whose weekly wages are more than or equal to Rs 400 but less than Rs 450 is 28
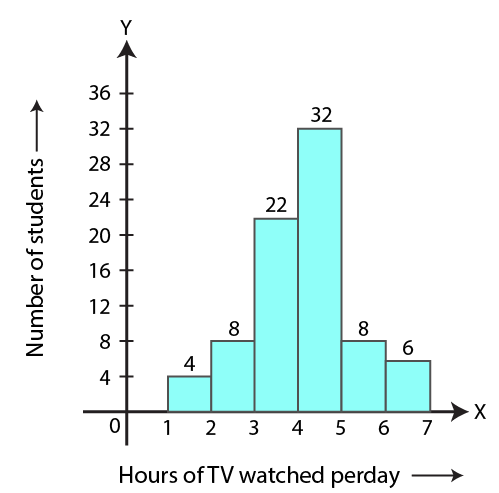
13. The number of hours for which students of a particular class watched television during holidays is shown in the histogram below.
Answer the following:
(i) For how many hours did the maximum number of students watch T.V.?
(ii) How many students watched T.V. for less than 4 hours?
(iii) How many students spent more than 5 hours in watching T.V.?
(iv) How many students spent more than 2 hours but less than 4 hours in watching T.V.?
Solution:
From the given histogram,
(i) Maximum number of students watch T.V for 4-5 hours
(ii) 34 students watch T.V. for less than 4 hours
(iii) 14 students spent more than 5 hours in watching T.V.
(iv) 30 students spent more than 2 hours but less than 4 hours in watching T.V.
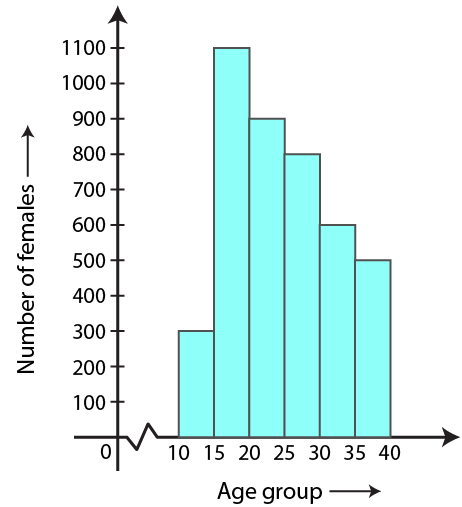
14. The number of literate females in the age group of 10 to 40 years in a town is shown in the histogram alongside.
Answer the following questions:
(i) Write the classes assuming all the classes are of equal width.
(ii) What is the class size?
(iii) In which age group are the literate females the least?
(iv) In which age group is the number of literate females the highest?
Solution:
(i) From the given histogram, the classes having equal width are 10-15, 15-20, 20-25, 25-30, 30-35, 35-40
(ii) In the given histogram, the class size is 5
(iii) In 10-15 age group, the literate females are the least
(iv) In 15-20 age group, the literate females are the highest
Exercise 19.2
1. The following data represents the different number of animals in a zoo. Prepare a pie chart for the given data.
| Animals | Deer | Tiger | Elephant | Giraffe | Reptiles |
| Number of animals | 40 | 10 | 30 | 15 | 25 |
Solution:
| Animals | Number of animals | Central degree |
| DeerTigerElephantGiraffeReptiles | 4010301525 | (3600 × 40) / 120 = 1200(3600 × 10) / 120 = 300(3600 × 30) / 120 = 900(3600 × 15) / 120 = 450(3600 × 25) / 120 = 750 |
| Total | 120 | 3600 |
Pie chart for the given data is shown below

2. The following data represents the monthly expenditure of a family (in T) on various items. Draw a pie chart to represent this data.
| Items | Food | House rent | Education | Savings | Health | Others |
| Expenditure (in Rs) | 12500 | 5000 | 7500 | 10000 | 5000 | 10000 |
Solution:
| Items | Expenditure (in Rs) | Central angles |
| FoodHouse rentEducationSavingsHealthOthers | 125005000750010000500010000 | (12500 × 3600) / 50000 = 900(5000 × 3600) / 50000 = 360(7500 × 3600) / 50000 = 540(10000 × 3600) / 50000 = 720(5000 × 3600) / 50000 = 360(10000 × 3600) / 50000 = 720 |
| Total | 50000 | 3600 |
Pie chart for the given data is shown below

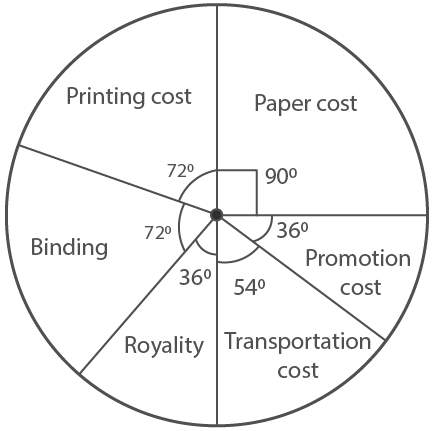
3. The following data represents the percentage distribution of the expenditure incurred in publishing a book.
| Items | Paper cost | Printing cost | Binding | Royality | Transportationcost | Promotion cost |
| Expenditure (in %) | 25% | 20% | 20% | 10% | 15% | 10% |
Solution:
| Items | Expenditure | Central angles |
| Paper costPrinting costBindingRoyalityTransportation costPromotion cost | 25%20%20%10%15%10% | (3600 × 25) / 100 = 900(3600 × 20) / 100 = 720(3600 × 20) / 100 = 720(3600 × 10) / 100 = 360(3600 × 15) / 100 = 540(3600 × 10) / 100 = 360 |
| Total | 100% | 3600 |
Pie chart representing the given data is as follows:
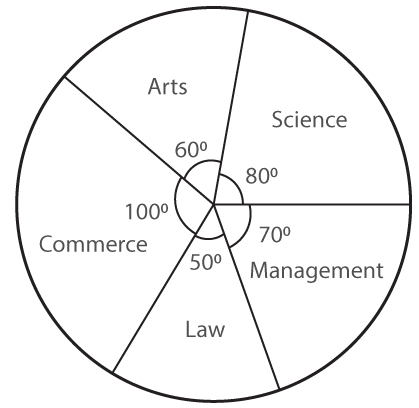
4. The following data represents the number of students got admission in different streams of a college:
| Stream | Science | Arts | Commerce | Law | Management |
| Number of students | 400 | 300 | 500 | 250 | 350 |
Draw a pie chart to represent this data
Solution:
| Stream | Number of students | Central angle |
| ScienceArtsCommerceLawManagement | 400300500250350 | (400 × 3600) / 1800 = 800(300 × 3600) / 1800 = 600(500 × 3600) / 1800 = 1000(250 × 3600) / 1800 = 500(350 × 3600) / 1800 = 700 |
| Total | 1800 | 3600 |
Pie chart representing the above given data is shown below:
5. The adjoining pie chart shows the expenditure of a country on various sports during year 2012. Study the pie chart carefully and answer the following questions:
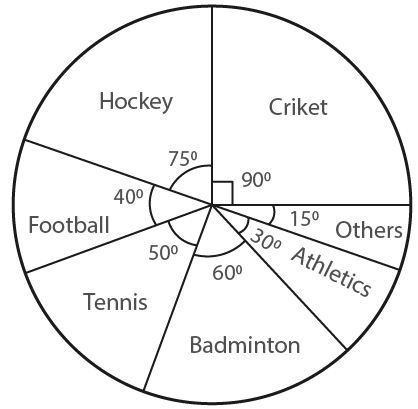
(i) What percent of total expenditure is spent on cricket?
(ii) How much percent more is spent on hockey than that on tennis?
(iii) If the total amount spent on sports in 2012 is Rs 1, 80, 00, 000 then find the amount spent on Badminton
(iv) If the total amount spent on sports in 2012 is Rs 2, 40, 00, 000 then find the amount spent on cricket and hockey together.
Solution:
The given pie chart represents the expenditure of a country on various sports during year 2012
(i) Given that expenditure on a cricket = 900
So,
(90 / 3600) × 100% = 25%
Therefore, 25% expenditure is spent on cricket
(ii) Given that expenditure on a hockey = 750
So,
(70 / 3600) × 100% = (125 / 6)% = %
%
Expenditure on tennis = 500
Hence, (50 / 3600) × 100% = (125 / 9)% = 13.9%
So,
(125 / 6) – (125 / 9) = 125 / 18
= (375 – 250) / 18
= 125 / 18
= 6.95% more
Therefore, 6.95% more is spent on hockey than that on tennis
(iii) Total amount spent on sports = Rs 1, 80, 00, 000
Total amount spent on Badminton = Rs 1, 80, 00,000 × (60 / 3600)
= Rs 30,00,000
(iv) If the total amount spent on sports = 2,40,00,000
Total amount spent on cricket and hockey together = 900 + 750
= 1650
= (1650 / 3600) × 2, 40, 00,000
= 1, 10, 00, 000
6. The adjoining pie chart shows the number of students enrolled in class VI to class X of a school.
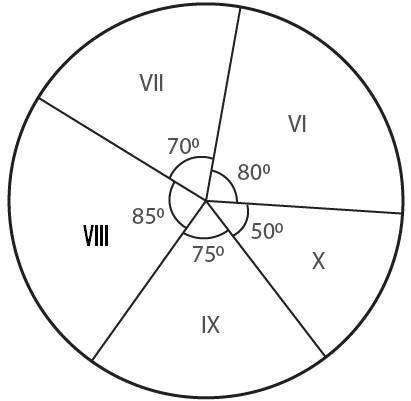
If 1440 students are enrolled from VI to X, then answer the following questions:
(i) How many students are enrolled in class VIII?
(ii) How many students are more in class IX than in class X?
(iii) What is the sum of students enrolled in VII and VIII?
(iv) Find the ratio of students enrolled in VI to students enrolled in X
Solution:
The given pie chart represents the enrolment of students from class VI to class X in a school.
Total number of students enrolled from VI to X = 1440 students
(i) Enrolment of class VIII = (85 / 3600) × 1440 = 340 students
(ii) Difference in X and IX class enrolment = 750 – 500
= 250
(25 / 3600) × 1440 = 100 students
Therefore, 100 students are more in class IX than in class X
(iii) Sum of students enrolled in VII and VIII classes = 700 + 850
= 1550
(155 / 3600) × 1440 = 620 students
Therefore, the sum of students enrolled in class VI and VIII = 620 students
(iv) Ratio between the students enrolled in VI to students enrolled in X classes = 800: 500
= 8: 5
Therefore, the ratio between the students enrolled in VI to students enrolled in X classes is 8: 5
Exercise 19.3
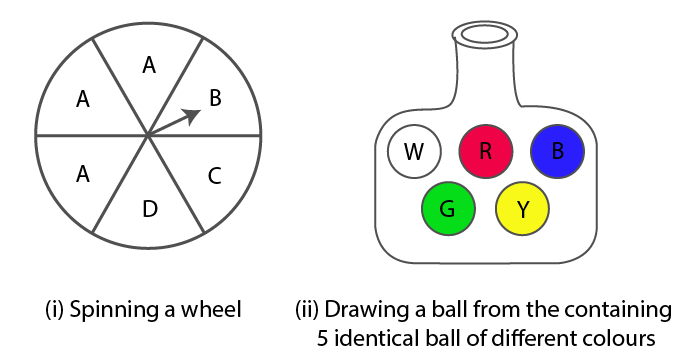
1. List the outcomes you can see in these experiments
Solution:
(i) The outcomes in spinning wheel = A, A, A, B, C, D
(ii) The outcomes in drawing a ball from a bag containing 5 identical balls of different colours = White, Red, Blue, Green, Yellow
2. A die is rolled once. Find the probability of getting
(i) an even number
(ii) a multiple of 3
(iii) not a multiple of 3
Solution:
Total outcomes of a die when rolled once:
1, 2, 3, 4, 5, 6 = 6
(i) An even number: 2, 4, 6
i.e, Favourable outcomes = 3
Therefore,
Probability P(E) = 3 / 6
= 1 / 2
(ii) Multiple of 3 = 3, 6
i.e, Favourable outcomes = 2
Therefore,
Probability P(E) = 2 / 6
= 1 / 3
(iii) Not a multiple of 3 = 1, 2, 4, 5
i.e Favourable outcomes = 4
Therefore,
Probability P(E) = 4 / 6
= 2 / 3
3. Two coins are tossed together. Find the probability of getting
(i) two tails
(ii) atleast one tail
(iii) no tail
Solution:
The total outcomes, when two coins are tossed together = 2 × 2
= 4
Therefore, outcomes are,
HH, HT, TH, TT
(i) Favourable outcomes of getting two tails = 1
Hence,
Probability P(E) = 1 / 4
(ii) Favourable outcomes of getting atleast one tail = TH, HT, TT
= 3
Hence,
Probability P(E) = 3 / 4
(iii) Favourable outcomes of getting no tail = HH
= 1
Hence,
Probability P(E) = 1 / 4
4. Three coins are tossed together. Find the probability of getting
(i) atleast two heads
(ii) atleast one tail
(iii) atmost one tail
Solution:
Three coins are tossed together
Hence,
Total outcomes = 8
= HHH, HHT, HTH, THH, HTT, TTH, TTT, THT
(i) Favourable outcomes of getting atleast two heads = HHH, HHT, HTH, THH
= 4 in numbers
Therefore,
Probability P(E) = (Number of favourable outcome) / (Number of possible outcome)
= 4 / 8
= 1 / 2
(ii) Favourable outcomes of getting atleast one tail = HHT, HTH, HTT, TTT, THH, THT, TTH
= 7 in numbers
Therefore,
Probability P(E) = (Number of favourable outcome) / (Number of possible outcome)
= 7 / 8
(iii) Favorable outcomes of getting atmost one tail = HHH, HHT, HTH, THH
= 4 in numbers
Therefore,
Probability P(E) = (Number of favourable outcome) / (Number of possible outcome)
= 4 / 8
= 1 / 2
5. Two dice are rolled simultaneaously. Find the probability of getting
(i) the sum as 7
(ii) the sum as 3 or 4
(iii) prime numbers on both the dice.
Solution:
Two dice are rolled simultaneously, then
Total outcomes = 6 × 6
= 36
(i) Sum as 7 = (1, 6), (2, 5), (3, 4), (4, 3), (5, 2), (6, 1)
= 6
Therefore,
Probability P(E) = (Favourable outcome) / (Total outcome)
= 6 / 36
= 1 / 6
(ii) The sum as 3 or 4 = (1, 2), (1, 3), (2, 1), (2, 2), (3, 1)
= 5
Therefore,
Probability P(E) = (Favourable outcome) / (Total outcome)
= 5 / 36
(iii) Prime numbers on both the side = (2, 2), (2, 3), (2, 5), (3, 2), (3, 3), (3, 5), (5, 2), (5, 3), (5, 5)
= 9
Therefore,
Probability P(E) = (Favourable outcome) / (Total outcome)
= 9 / 36
= 1 / 4
6. A box contains 600 screws, one tenth are rusted. One screw is taken out at random from the box. Find the probability that it is
(i) a rusted screw
(ii) not a rusted screw
Solution:
Given
Rusted screw = (1 / 10) of 600
= (1 / 10) × 600
= 60 seconds
(i) Favourable outcomes of picking rusted screw = 60
Therefore,
Probability P(E) = 60 / 600
= 1 / 10
(ii) Probability (of not rusted screw) = 1 – Probability (of rusted screw)
= 1 – 1 / 10
= (10 – 1) / 10
= 9 / 10
7. A letter is chosen from the word ‘TRIANGLE’. What is the probability that it is a vowel?
Solution:
Given word,
‘TRIANGLE’
Total number of outcomes = 8
Vowels = I, A, E = 3
Therefore,
Probability P(E) = 3 / 8
Hence, the probability of vowel in ‘TRIANGLE’ is 3 / 8
8. A bag contains 5 red, 6 black and 4 white balls. A ball is drawn at random from the bag, find the probability the ball is drawn is
(i) white
(ii) not black
(iii) red or black
(iv) neither red nor black
Solution:
Given
In a bag, there are 5 red, 6 black and 4 white balls.
Then, total number of outcomes = 5 + 6 + 4
= 15
(i) Probability of white ball = 4 / 15
(ii) Probability of not black = 5 + 4
= 9 balls
Therefore,
Probability of not black = 9 / 15 = 3 / 5
(iii) Probability of red or black = 5 + 6
= 11
Therefore,
Probability of red or black = 11 / 15
(iv) Probability of ball which is neither red nor black, i.e, white ball = 4
Therefore,
Probability of ball which is neither red nor black = 4 / 15
9. A box contains 17 cards numbered 1, 2, 3…….., 17 and are mixed thoroughly. A card is drawn at random from the box. Find the probability that the number on that card is
(i) odd
(ii) even
(iii) prime
(iv) divisible by 3
(v) divisible by 2 and 3 both
Solution:
Given
A box contains 17 cards numbered 1 to 17
So, total number of outcomes = 17
(i) Card bearing odd number
(1, 3, 5, 7, 9, 11, 13, 15, 17) = 9
Therefore,
Probability P(E) = 9 / 17
(ii) Even number
(2, 4, 6, 8, 10, 12, 14, 16) = 8
Therefore,
Probability P(E) = 8 / 17
(iii) Prime numbers
(2, 3, 5, 7, 11, 13, 17) = 7
Therefore,
Probability P(E) = 7 / 17
(iv) Numbers divisible by 3
3, 6, 9, 12, 15 = 5
Therefore,
Probability P(E) = 5 / 17
(v) Numbers divisible by 2 and 3 both
6, 12 = 2
Therefore,
Probability P(E) = 2 / 17
10. A card is drawn from a well-shuffled pack of 52 cards. Find the probability that the card drawn is:
(i) an ace
(ii) a red card
(iii) neither a king nor a queen
(iv) a red face card or an ace
(v) a card of spade
(vi) non-face card of red colour
Solution:
Total number of playing cards = 52
One card is drawn
(i) An ace = 4
Therefore,
Probability P(E) = 4 / 52
= 1 / 13
(ii) A red card = 13 + 13 = 26
Therefore,
Probability P(E) = 26 / 52
= 1 / 2
(iii) Neither a king nor a queen
Number of cards = 52 – (4 + 4)
= 52 – 8
= 44
Therefore,
Probability P(E) = 44 / 52
= 11 / 13
(iv) A red face card = 6
Therefore,
Probability P(E) = 6 / 52
= 3 / 26
(v) A card of spade or an ace = 13 + 3
= 16
Therefore,
Probability P(E) = 16 / 52
= 4 / 13
(vi) Non-face card of red colour = 26 – 6
= 20
Therefore,
Probability P(E) = 20 / 52
= 5 / 13
11. In a lottery, there are 5 prized tickets and 995 blank tickets. A person buys a lottery ticket. Find the probability of his winning a prize.
Solution:
Given
Number of prized tickets = 5
Number of blank tickets = 995
So, total number of tickets = 5 + 995
= 1000
Probability of prized ticket P(E) = (Number of favourable outcome) / (Number of possible outcome)
= 5 / 1000
= 1 / 200
Therefore, the probability of his winning prize is 1 / 200
Download PDF
ML Aggarwal Solutions for Class 8 Maths Chapter 19- Data Handling
Download PDF: ML Aggarwal Solutions for Class 8 Maths Chapter 19- Data Handling PDF
Chapterwise ML Aggarwal Solutions for Class 8 Maths :
- Chapter 1- Rational Numbers
- Chapter 2- Exponents and Powers
- Chapter 3- Squares and Square Roots
- Chapter 4- Cubes and Cube Roots
- Chapter 5- Playing with Numbers
- Chapter 6- Operation On Sets Venn Diagram
- Chapter 7- Percentage
- Chapter 8- Simple and Compound Interest
- Chapter 9- Direct and Inverse Variation
- Chapter 10- Algebraic Expressions and Identities
- Chapter 11- Factorisation
- Chapter 12- Linear Equations and Inequalities in One Variable
- Chapter 13- Understanding Quadrilaterals
- Chapter 14- Constructions of Quadrilaterals
- Chapter 15- Circle
- Chapter 16- Symmetry Reflection and Rotation
- Chapter 17- Visualising Solid Shapes
- Chapter 18- Mensuration
- Chapter 19- Data Handling
About ML Aggarwal
M. L. Aggarwal, is an Indian mechanical engineer, educator. His achievements include research in solutions of industrial problems related to fatigue design. Recipient Best Paper award, Manipal Institute of Technology, 2004. Member of TSTE.