
Class 11: Maths Chapter 8 solutions. Complete Class 11 Maths Chapter 8 Notes.
Maharashtra Board Solutions Class 11-Arts & Science Maths (Part 1): Chapter 8- Measures of Dispersion
Maharashtra Board 11th Maths Chapter 8, Class 11 Maths Chapter 8 solutions
Ex 8.1
Question 1.
Find a range of the following data:
19, 27, 15, 21, 33, 45, 7, 12, 20, 26
Solution:
Here, largest value (L) = 45, smallest value (S) = 7
∴ Range = L – S = 45 – 7 = 38
Question 2.
Find range of the following data:
575, 609, 335, 280, 729, 544, 852, 427, 967, 250
Solution:
Here, largest value (L) = 967, smallest value (S) = 250
∴ Range = L – S = 967 – 250 = 717
Question 3.
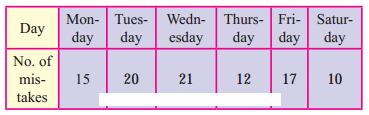
The following data gives a number of typing mistakes done by Radha during a week. Find the range of the data.
Solution:
Here, largest value (L) = 21, smallest value (S) = 10
∴ Range = L – S = 21 – 10 = 11
Question 4.
The following results were obtained by rolling a die 25 times. Find the range of the data.
Solution:
Here, largest value (L) = 6, smallest value (S) = 1
∴ Range = L – S = 6 – 1 = 5
Question 5.
Find range for the following data:
Solution:
Here, upper limit of the highest class (L) = 72
lower limit of the lowest class (S) = 62
∴ Range = L – S = 72 – 62 = 10
Ex 8.2
Question 1.
Find variance and S.D. for the following set of numbers.
7, 11, 2, 4, 9, 6, 3, 7, 11, 2, 5, 8, 3, 6, 8, 8, 2, 6
Solution:
Given data:
7, 11, 2, 4, 9, 6, 3, 7, 11, 2, 5, 8, 3, 6, 8, 8, 2, 6
The tabulated form of the above data is
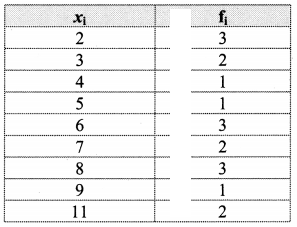
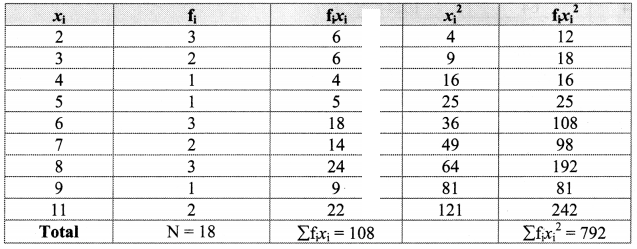
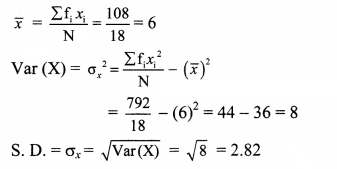
Calculation of variance and S.D.
Question 2.
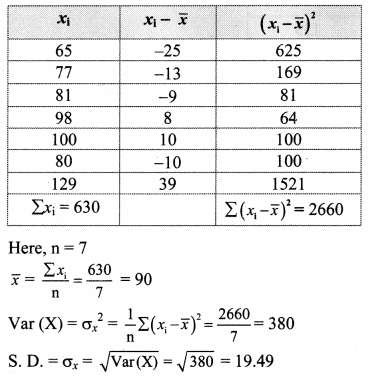
Find variance and S.D. for the following set of numbers.
65, 77, 81, 98, 100, 80, 129
Solution:
Question 3.
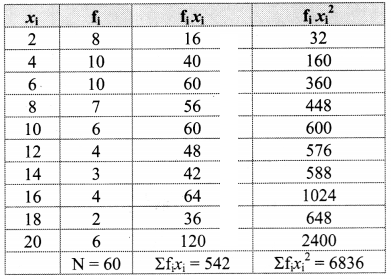
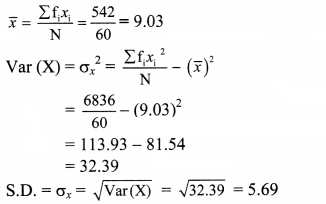
Compute variance and standard deviation for the following data:
Solution:
Question 4.
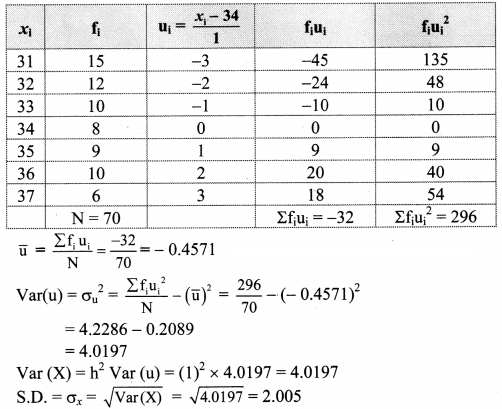
Compute the variance and S.D.
Solution:
Let u = x−Ah=x−341
Calculation of variance of u:
Question 5.
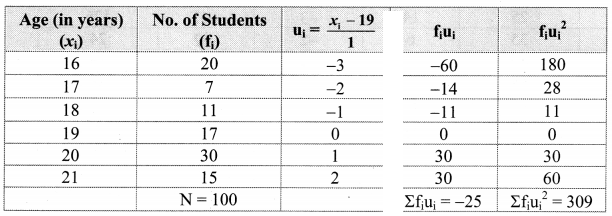
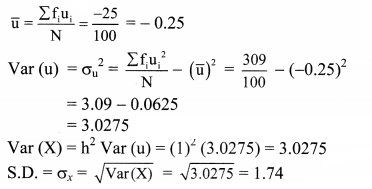
Following data gives ages of 100 students in a college. Calculate variance and S.D.
Solution:
Let u = x−Ah=x−191
Question 6.
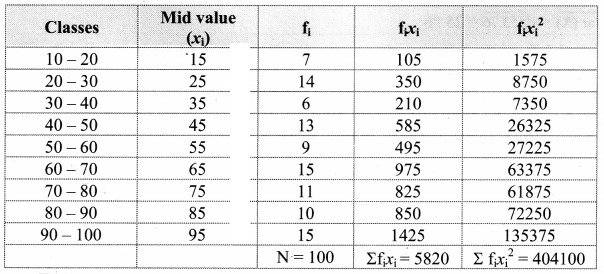
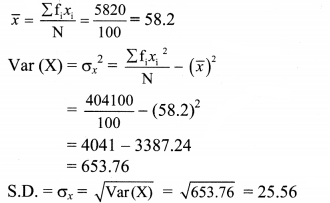
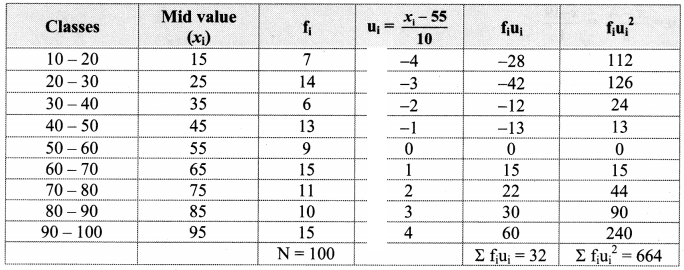
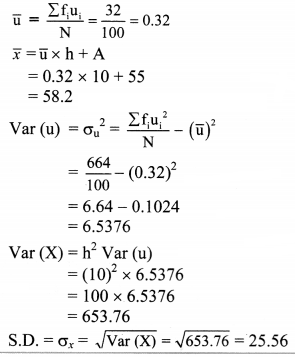
Find mean, variance and S.D. of the following data.
Solution:
Alternate Method:
Let u = x−Ah=x−5510
Calculation of variance of u:
Question 7.
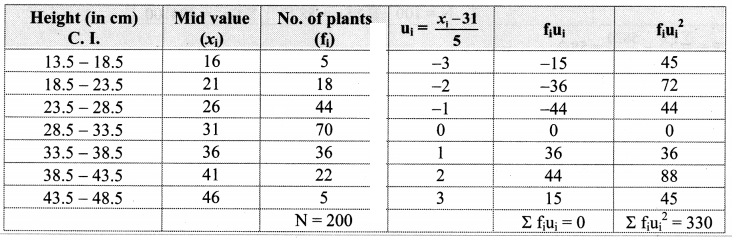
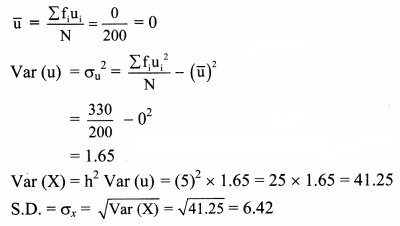
Find the variance and S.D. of the following frequency distribution which gives the distribution of 200 plants according to their height.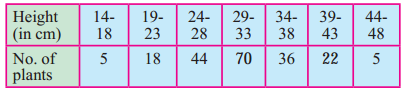
Solution:
Since data is not continuous, we have to make it continuous.
Let u = x−Ah=x−315
Calculation of variance of u:
Question 8.
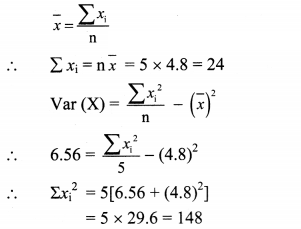
The mean of 5 observations is 4.8 and the variance is 6.56. If three of the five observations are 1, 3, and 8, find the other two observations.
Solution:
x¯ = 4.8, Var (X) = 6.56, n = 5, x1 = 1, x2 = 3, x3 = 8 ……(given)
Let the remaining two observations be x4 and x5.
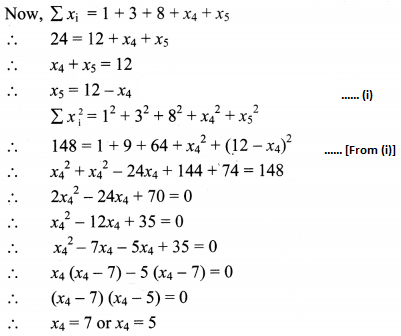
From (i), we get
x5 = 5 or x5 = 7
∴ The two numbers are 5 and 7.
Ex 8.3
Question 1.
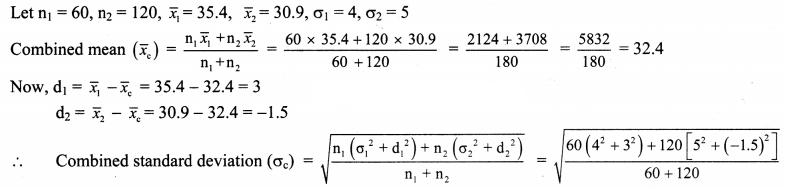
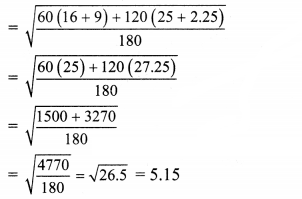
The means of two samples of sizes 60 and 120 respectively are 35.4 and 30.9 and the standard deviations are 4 and 5. Obtain the standard deviation of the sample of size 180 obtained by combining the two samples.
Solution:
Question 2.
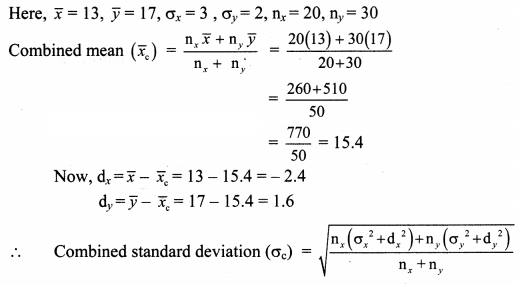
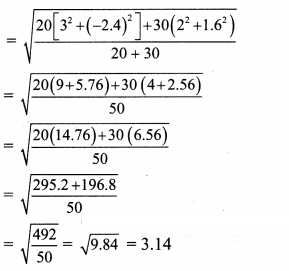
For certain data, the following information is available.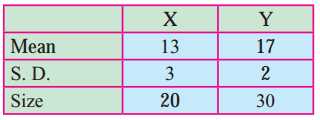
Obtain the combined standard deviation.
Solution:
Question 3.
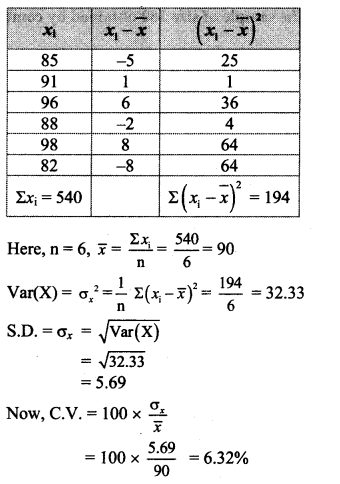
Calculate the coefficient of variation of marks secured by a student in the exam, where the marks are:
85, 91, 96, 88, 98, 82
Solution:
Question 4.
Find the coefficient of variation of a sample that has a mean equal to 25 and a standard deviation of 5.
Solution: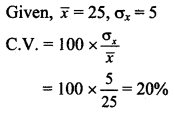
Question 5.
A group of 65 students of class XI has their average height as 150.4 cm with a coefficient of variance of 2.5%. What is the standard deviation of their heights?
Solution:
Given, n = 65, x¯ = 150.4, C.V. = 2.5%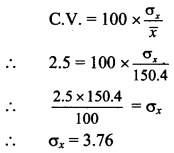
∴ The standard deviation of students’ height is 3.76 cm.
Question 6.
Two workers on the same job show the following results:
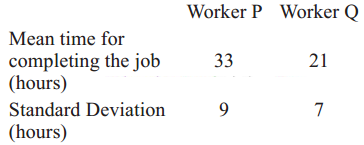
(i) Regarding the time required to complete the job, which worker is more consistent?
(ii) Which worker seems to be faster in completing the job?
Solution:
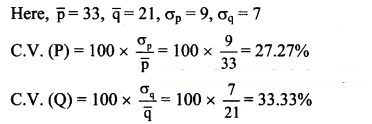
(i) Since C.V. (P) < C.V.(Q), Worker P is more consistent regarding the time required to complete the job. (ii) Since p¯¯¯>q¯¯¯,
i.e., the expected time for completing the job is less for worker Q.
∴ Worker Q seems to be faster in completing the job.
Question 7.
A company has two departments with 42 and 60 employees respectively. Their average weekly wages are ₹ 750 and ₹ 400. The standard deviations are 8 and 10 respectively.
(i) Which department has a larger bill?
(ii) Which department has larger variability in wages?
Solution:
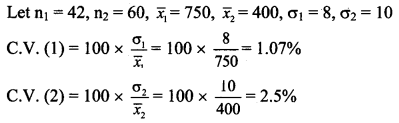
(i) Since x¯1>x¯2,
i.e., average weekly wages are more for the first department.
∴ The first department has a larger bill.
(ii) Since C.V. (1) < C.V. (2),
second department is less consistent.
∴ The second department has larger variability in wages.
Question 8.
The following table gives the weights of the students of two classes. Calculate the coefficient of variation of the two distributions. Which series is more variable?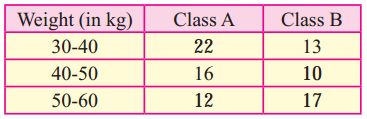
Solution:
Let x denote the data of class A and y denote the data of class B.
Calculation of S.D. for class A:
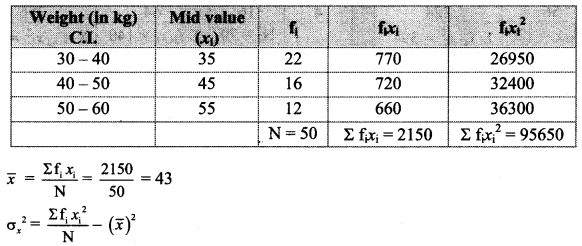
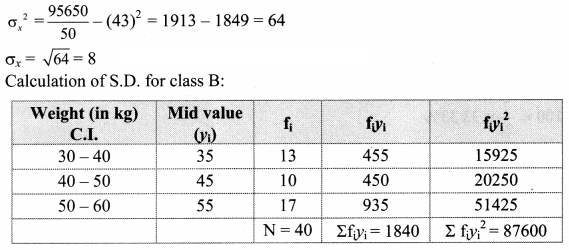
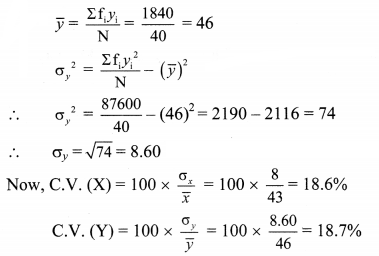
Since C.V. (Y) > C.V.(X),
C.V. (B) > C.V. (A)
∴ Series B is more variable.
Question 9.
Compute the coefficient of variation for team A and team B.
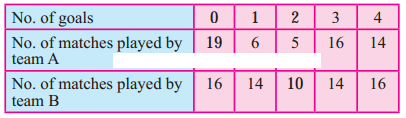
Which team is more consistent?
Solution:
Let f1 denote no. of goals of team A and f2 denote no. of goals of team B.
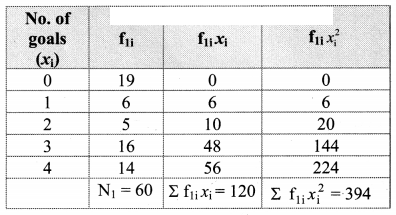
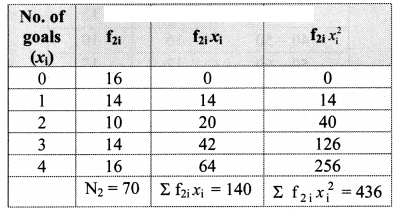
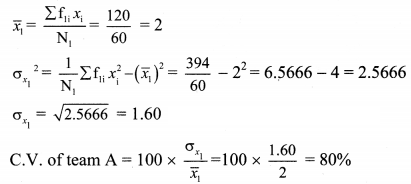
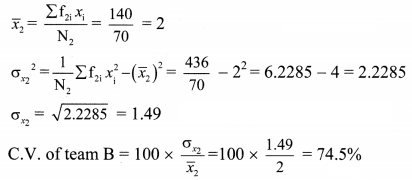
Since C.V. of team A > C.V. of team B,
Team B is more consistent.
Question 10.
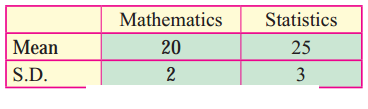
Given below is the information about marks obtained in Mathematics and Statistics by 100 students in a class. Which subject shows the highest variability in marks?
Solution:
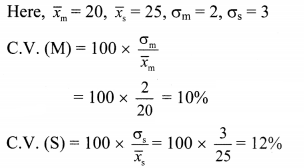
Since C.V. (S) > C.V. (M),
The subject statistics show higher variability in marks.
Download PDF
Maharashtra Board Solutions Class 11-Arts & Science Maths (Part 1): Chapter 8- Measures of Dispersion
Chapterwise Maharashtra Board Solutions Class 11 Arts & Science Maths (Part 1) :
- Chapter 1- Angle and its Measurement
- Chapter 2- Trigonometry – I
- Chapter 3- Trigonometry – II
- Chapter 4- Determinants and Matrices
- Chapter 5- Straight Line
- Chapter 6- Circle
- Chapter 7- Conic Sections
- Chapter 8- Measures of Dispersion
- Chapter 9- Probability