
Class 6: Maths Chapter 33 solutions. Complete Class 6 Maths Chapter 33 Notes.
Contents
Selina Class 6 ICSE Solutions Mathematics : Chapter 33- Data Handling
Selina 6th Maths Chapter 33, Class 6 Maths Chapter 33 solutions
Exercise 33(A)
1.Marks scored by 30 students of class VI are as given below:
38, 46, 33, 45, 63, 53, 40, 85, 52, 75, 60, 73, 62, 22, 69, 43, 45, 33, 47, 41, 29, 43, 37, 49, 83, 44, 55, 22, 35 and 45. State:
(i) the highest marks scored
(ii) the lowest marks scored
(iii) the range of marks
Solution:
(i) The highest marks scored is 85
(ii) The lowest marks scored is 22
(iii) Range of marks = Difference between highest and lowest marks
= 85 – 22
= 63
Therefore, the range of marks is 63
2. For the following raw data, form a discrete frequency distribution:
30, 32, 32, 28, 34, 34, 32, 30, 30, 32, 32, 34, 30, 32, 32. 28, 32, 30, 28, 30, 32, 32, 30, 28 and 30
Solution:
The required frequency table is shown below
Marks Tally marks Frequency
28  4
4
30  8
8
32  10
10
34  3
3
Total 25
3. Define:
(i) data
(ii) frequency of an observation
Solution:
(i) Data: Information in the form of numerical figures is known as data
(ii) Frequency of an observation: The number of times a particular observation occurs is known as its frequency
4. Rearrange the following raw data in descending order:
5.3, 5.2, 5.1, 5.7, 5.6, 6.0, 5.5, 5.9, 5.8, 6.1, 5.5, 5.8, 5.7, 5.9 and 5.4. Then write the:
(i) highest value
(ii) lowest value
(iii) range of values
Solution:
The given numbers in descending order are as follows:
6.1, 6.0, 5.9, 5.9, 5.8, 5.8, 5.7, 5.7, 5.6, 5.5, 5.5, 5.4, 5.3, 5.2, 5.1
(i) Hence, the highest value is 6.1
(ii) Hence, the lowest value is 5.1
(iii) Range of values = Difference between highest value and lowest value
Hence,
Range of values = highest value – lowest value
= 6.1 – 5.1
= 1.0
5. Represent the following data in the form of a frequency distribution:
52, 56, 72, 68, 52, 68, 52, 68, 52, 60, 56, 72, 56, 60, 64, 56, 48, 48, 64 and 64
Solution:
The required frequency table for the given data is as follows:
Marks Tally marks Frequency
48  2
2
52  4
4
56  4
4
60  2
2
64  3
3
68  3
3
72  2
2
Total 20
6. In a study of number of accidents per day, the observations for 30 days were obtained as follows:
6 3 5 6 4 3 2 5 4 2
4 0 5 3 6 1 5 5 2 6
2 1 2 2 0 5 4 6 1 6
Construct a suitable frequency distribution table.
Solution:
The required frequency table is shown below:
No. of accidents Tally marks Frequency
0  2
2
1  3
3
2  6
6
3  3
3
4  4
4
5  6
6
6  6
6
Total 30
7. The following data represents the weekly wages (in Rs) of 15 workers in a factory:
900, 850, 800, 850, 800, 750, 950, 900, 950, 800, 750, 900, 750, 800 and 850
Prepare a frequency distribution table. Now find,
(i) how many workers are getting less than Rs 850 per week?
(ii) how many workers are getting more than Rs 800 per week?
Solution:
The required frequency table is as follows:
Weekly wage (in Rs.) Tally marks Frequency
750  3
3
800  4
4
850  3
3
900  3
3
950  2
2
Total no. of workers 15
(i) Number of workers getting less than Rs 850 per week are,
Number of workers getting Rs 750 = 3 workers
Number of workers getting Rs 800 = 4 workers
Hence, workers getting less than Rs 850 = 4 + 3
= 7 workers
Therefore, 7 workers are getting less than Rs 850 per week
(ii) Number of workers getting more than Rs 800 per week are,
Number of workers getting Rs 850 = 3
Number of workers getting Rs 900 = 3
Number of workers getting Rs 950 = 2
So, number of workers getting more than Rs 800 = 3 + 3 + 2
= 8 workers
Therefore, 8 workers are getting more than Rs 800 per week
8. Using the data, given below, construct a frequency distribution table:
9, 17, 12, 20, 9, 18, 25, 17, 19, 9, 12, 9, 12, 18, 17, 19, 20, 25, 9 and 12. Now answer the following:
(i) How many numbers are less than 19?
(ii) How many numbers are more than 20?
(iii) Which of the numbers, given above, is occurring most frequently?
Solution:
The required frequency table is as follows:
Marks Tally marks Frequency
9  5
5
12  4
4
17  3
3
18  2
2
19  2
2
20  2
2
25  2
2
Total 20
(i) Total numbers less than 19 = 14
(ii) Total numbers more than 20 = 2
(iii) The number 9 occurs 5 times.
Hence, the number which is occurring most frequently is 9
9. Using the following data, construct a frequency distribution table: 46, 44, 42, 54, 52, 60, 50, 58, 56, 62, 50, 56, 54, 58 and 48
Now answer the following:
(i) What is the range of the numbers?
(ii) How many numbers are greater than 50?
(iii) How many numbers are between 40 and 50?
Solution:
Marks Tally marks Frequency
42 | 1
44 | 1
46 | 1
48 | 1
50 || 2
52 | 1
54 || 2
56 || 2
58 || 2
60 | 1
62 | 1
Total 15
(i) Range of numbers = Highest number – Lowest number
= 62 – 42
= 20
(ii) There are 9 numbers which are greater than 50
(iii) There are 6 numbers which are between 40 and 50
Exercise 33(B)
1. The sale of vehicles, in a particular city, during the first six months of the year 2016 is shown below:
Month Jan Feb March April May June
Number of 3000 2500 4000 1000 1500 3500
vehicles sold
Draw a pictograph to represent the above data
Solution:
Let us consider one = 500 vehicles sold
Hence, the pictograph to represent the data is shown below

2. The following pictograph shows the number of cars sold by four dealers A, B, C and D in a city. Scale: = 50 cars

Using the pictograph, drawn above, answer the following questions:
(i) How many more cars has dealer A sold as compared to dealer D?
(ii) What is the total number of cars sold by all the dealers?
Solution:
Given
One figure = 50 cars
Hence, cars sold by dealer A and D can be calculated as below
Cars sold by A = 6 × 50
= 300 cars
Cars sold by D = 4 × 50
= 200 cars
Total cars sold by A than D = 300 – 200
= 100
Hence, A sold 100 more cars than D
(ii) Total number of cars = 23
Scale = 50 cars
Hence,
Total number of cars sold by all the dealers can be calculated as below
Total number of cars sold = 23 × 50
= 1150 cars
Hence, total number of cars sold by all the dealers is 1150 cars
3. The following pictograph shows the number of watches manufactured by a factory, in a particular weeks.

Scale: = 100 watches
Find
(i) on which day were the least number of watches manufactured?
(ii) total number of watches manufactured in the whole week?
Solution:
(i) The day on which the least number of watches are manufactured is Friday
Number of watches manufactured on Friday = 100 × 5
= 500 watches
(ii) Total number of watches manufactured in the whole week can be calculated as below
Total number of watches manufactured = 100 × 42.5
= 4250 watches
4. The number or animals in five villages are as follows:
| Village | A | B | C | D | E |
| No. of animals | 160 | 240 | 180 | 80 | 120 |
Prepare a pictograph of these animals using one symbol to represent 20 animals.
Solution:
Let represents 20 animals
Hence, the pictograph representing animals in five villages are as follows:

5. The following pictograph shows different subject books which are kept in a school library.

Taking symbol of one book = 50 books, find:
(i) how many History books are there in the library?
(ii) how many Science books are there in the library?
(iii) Which books are maximum in number?
Solution:
(i) Given
One book = 50 books
Hence, total number of History books can be calculated as below
Total number of History books = 50 × 4
= 200 books
Therefore, there are 200 History books in the library
(ii) Given
One book = 50 books
Hence, total number of Science books can be calculated as below
Total number of Science books = 50 × 5.5
= 275 books
Therefore, there are 275 Science books in the library
(iii) From the given pictograph, English books are maximum in number in the library
Given
One book = 50 books
Hence, total number of English books can be calculated as below
Total number of English books = 50 × 9
= 450 books
Therefore, there are 450 English books in the library
Exercise 33(C)
1. The following table gives the number of students in class VI in a school during academic years 2011- 2012 to 2015- 2016.
| Academic years | 2011-2012 | 2012- 2013 | 2013- 2014 | 2014- 2015 | 2015- 2016 |
| No. of students | 80 | 120 | 130 | 150 | 180 |
Represent the above data by a bar graph.
Solution:
The bar graph to represent the above data is as follows:

2. The attendance of a particular class for the six days of a week are as given below:
| Day | Monday | Tuesday | Wednesday | Thursday | Friday | Saturday |
| Attendence | 48 | 44 | 40 | 36 | 39 | 43 |
Draw a suitable graph.
Solution:

3. The total number of students present in class VI B, for the six day in a week were as given below. Draw a suitable bar graph.
| Day | Monday | Tuesday | Wednesday | Thursday | Friday | Saturday |
| No. of student present | 40 | 30 | 35 | 25 | 10 | 20 |
Solution:

4. The following table shows the population of a particular city at different years:
| Year | 1996 | 2001 | 2006 | 2011 | 2016 |
| Population in Lakh | 45 | 57 | 70 | 90 | 110 |
Represent the above information with the help of a suitable bar graph.
Solution:

5. In a survey of 300 families of a colony, the number of children in each family was recorded and the data has been represented by the bar graph, given below:

Read the graph carefully and answer the following questions:
(i) How many families have 2 children each?
(ii) How many families have no child?
(iii) What percentage of families have 4 children?
Solution:
(i) From the given figure, 60 families have 2 children each
(ii) From the given figure, all the families have children. Therefore, the answer is zero
(iii) The percentage of families having four children can be calculated as below
Percentage = (total no. of families having four children) / (total number of families having children) × 100
= 60 / 300 × 100
= 20%
Hence, 20% of families have four children
6. Use the data, given in the following table, to draw a bar graph
| A | B | C | D | E | F |
| 250 | 300 | 225 | 350 | 275 | 325 |
Out of A, B, C, D, E and F
(i) Which has the maximum value.
(ii) Which is greater A + D or B + E.
Solution:
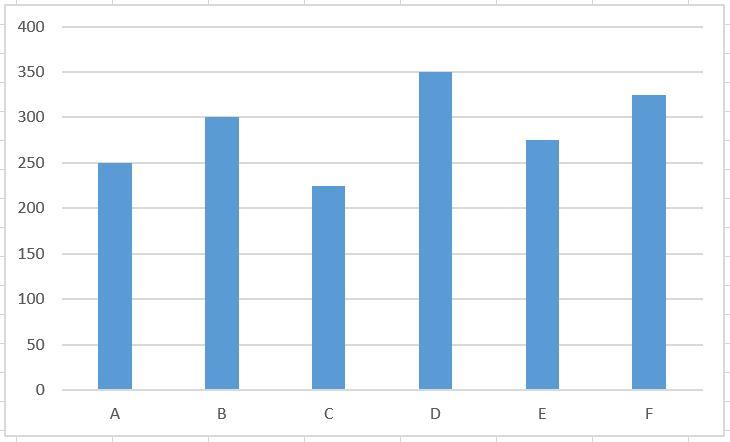
(i) From the given data, D has the maximum value of 350
(ii) A + D = 250 + 350
We get,
= 600
B + E = 300 + 275
We get,
= 575
We know that, 600 is greater than 575
Hence, A + D is greater than B + E
7. The bar graph drawn below shows the number of tickets sold during a fair by 6 students A, B, C, D, E and F

Using the Bar graph, answer the following question:
(i) Who sold the least number of tickets?
(ii) Who sold the maximum number of tickets?
(iii) How many tickets were sold by A, B and C taken together?
(iv) How many tickets were sold by D, E and F taken together?
(v) What is the average number of tickets sold per student?
Solution:
(i) From the given graph, the student D sold the least number of tickets i.e 7 tickets
(ii) From the given graph, the student E sold the maximum number of tickets i.e 24 tickets
(iii) From the given graph, total number of tickets sold by the student A, B and C can be calculated as below
Tickets sold by A, B and C taken together = (Tickets sold by A) + (Tickets sold by B) + (Tickets sold by C)
= 16 + 9 + 20
We get,
= 45
Therefore, total tickets sold by A, B and C together is 45 tickets
(iv) From the given graph, total number of tickets sold by the student D, E and F can be calculated as below
Tickets sold by D, E and F = (Tickets sold by D) + (Tickets sold by E) + (Tickets sold by F)
= 7 + 24 + 14
We get,
= 45
Hence, total tickets sold by D, E and F together is 45 tickets
(v) Average number of tickets sold per student can be calculated as below
Average tickets sold per student = (tickets sold by A + B + C + D + E + F) / 6
= (16 + 9 + 20 + 7 + 24 + 14) / 6
We get,
= 90 / 6
= 15
Hence, average tickets sold per student is 15 tickets
8. The following bar graph shows the number of children, in various classes, in a school in Delhi.

Using the given bar graph, find:
(i) the number of children in each class.
(ii) the total number of children from Class 6 to Class 8
(iii) how many more children there are in Class 5 compared to Class 6?
(iv) the total number of children from Class 1 to Class 8
(v) the average number of children in a class
Solution:
(i) From the given graph, the number of students in each class is as follows:
Class 1 = 100 students
Class 2 = 90 students
Class 3 = 100 students
Class 4 = 80 students
Class 5 = 120 students
Class 6 = 90 students
Class 7 = 70 students
Class 8 = 50 students
(ii) From the given graph, the number of students from Class 6 to Class 8 is as follows:
Class 6 = 90 students
Class 7 = 70 students
Class 8 = 50 students
Hence, total number of students in Class 6 to Class 8 can be calculated as below:
Total students = Students in Class 6 to Class 8
= 90 + 70 + 50
We get,
= 210
Hence, total number of students in Class 6, 7 and 8 are 210
(iii) From the given graph, students in Class 5 and Class 6 are as follows:
Class 5 = 120 students
Class 6 = 90 students
More students in Class 5 can be calculated as below
More students in Class 5 = 120 – 90
= 30
Hence, number of more students in Class 5 are 30
(iv) Total number of students in class 1 to 8 can be calculated as below
Total number of students = 100 + 90 + 100 + 80 + 120 + 90 + 70 + 50
We get,
= 700 students
Hence, there are 700 students in class 1 to 8
(v) Average number of students in each class can be calculated as below
Average number of students in each class = (Total number of students in classes) / Number of classes
= 700 / 8
We get,
= 87.5
9. The column graph, given above, shows the number of patients, examined by Dr. V.K. Bansal, on different days of a particular week.
Use the graph to answer the following:
(i) On which day were the maximum number of patients examined?
(ii) On which day were the least number of patients examined?
(iii) On which days were equal number of patients examined?
(iv) What is the total number of patients examined in the week?

Solution:
(i) From the given graph, the maximum number of patients is examined on Tuesday
(ii) From the given graph, the minimum number of patients is examined on Friday
(iii) From the given graph, equal number of patients is examined on Sunday and Thursday
(iv) Total number of patients examined in a week can be calculated as given below
Total number of patients examined in a week = 50 + 40 + 70 + 60 + 50 + 30
We get,
= 300 students
Hence, 300 patients are examined in a week
10. A student spends his pocket money on various items, as given below:
Books: Rs 380, Postage: Rs 30, Toilet items: Rs 240, Stationary: Rs 220 and Entertainment: Rs 120
Draw a bar graph to represent his expenses.
Solution:
Given
The amount spent on items is as follows:
Books = Rs 380
Postage = Rs 30
Toilet items = Rs 240
Stationary = Rs 220
Entertainment = Rs 120
The bar graph of the above given data is as follows

Download PDF
Selina Class 6 ICSE Solutions Mathematics : Chapter 33- Data Handling
Download PDF: Selina Class 6 ICSE Solutions Mathematics : Chapter 33- Data Handling PDF
Chapterwise Selina Publishers ICSE Solutions for Class 6 Mathematics :
- Chapter 1- Number System
- Chapter 2- Estimation
- Chapter 3- Numbers In Indian And International Systems
- Chapter 4- Place Value
- Chapter 5- Natural Numbers And Whole Numbers
- Chapter 6- Negative Numbers And Integers
- Chapter 7- Number Line
- Chapter 8- HCF And LCM
- Chapter 9- Playing With Numbers
- Chapter 10- Sets
- Chapter 11- Ratio
- Chapter 12- Proportion
- Chapter 13- Unitary Method
- Chapter 14- Fractions
- Chapter 15- Decimal Fractions
- Chapter 16- Percent (Percentage)
- Chapter 17- Idea of Speed, Distance and Time
- Chapter 18- Fundamental Concepts
- Chapter 19- Fundamental Operations
- Chapter 20- Substitution
- Chapter 21- Framing Algebraic Expressions (Including Evaluation)
- Chapter 22- Simple (Linear) Equations
- Chapter 23- Fundamental Concepts
- Chapter 24- Angles
- Chapter 25- Properties of Angles and Lines
- Chapter 26- Triangles
- Chapter 27- Quadrilateral
- Chapter 28- Polygons
- Chapter 29- The Circle
- Chapter 30- Revision Exercise Symmetry
- Chapter 31- Recognition of Solids
- Chapter 32- Perimeter and Area of Plane Figures
- Chapter 33- Data Handling
- Chapter 34- Mean and Median
About Selina Publishers ICSE
Selina Publishers has been serving the students since 1976 and is one of the quality ICSE school textbooks publication houses. Mathematics and Science books for classes 6-10 form the core of our business, apart from certain English and Hindi literature as well as a few primary books. All these books are based upon the syllabus published by the Council for the I.C.S.E. Examinations, New Delhi. The textbooks are composed by a panel of subject experts and vetted by teachers practising in ICSE schools all over the country. Continuous efforts are made in complying with the standards and ensuring lucidity and clarity in content, which makes them stand tall in the industry.