
Class 10: Maths Chapter 14 solutions. Complete Class 10 Maths Chapter 14 Notes.
Contents
NCERT Solutions for Maths: Chapter 14 – Statistics
NCERT 10th Maths Chapter 14, class 10 Maths Chapter 14 solutions
Page No: 270
Exercise 14.1
1. A survey was conducted by a group of students as a part of their environment awareness programme, in which they collected the following data regarding the number of plants in 20 houses in a locality. Find the mean number of plants per house.
| Number of Plants | 0-2 | 2-4 | 4-6 | 6-8 | 8-10 | 10-12 | 12-14 |
| Number of Houses | 1 | 2 | 1 | 5 | 6 | 2 | 3 |
Which method did you use for finding the mean, and why?
Answer
| No. of plants (Class interval) | No. of houses (fi) | Mid-point (xi) | fixi |
| 0-2 | 1 | 1 | 1 |
| 2-4 | 2 | 3 | 6 |
| 4-6 | 1 | 5 | 5 |
| 6-8 | 5 | 7 | 35 |
| 8-10 | 6 | 9 | 54 |
| 10-12 | 2 | 11 | 22 |
| 12-14 | 3 | 13 | 39 |
| Sum fi = 20 | Sum fixi = 162 |
Mean = x̄ = ∑fixi /∑fi = 162/20 = 8.1
We would use direct method because the numerical value of fi and xi are small.
2. Consider the following distribution of daily wages of 50 workers of a factory.
| Daily wages (in Rs.) | 100-120 | 120-140 | 140-160 | 160-180 | 180-200 |
| Number of workers | 12 | 14 | 8 | 6 | 10 |
Find the mean daily wages of the workers of the factory by using an appropriate method.
Answer
Here, the value of mid-point (xi) is very large, so assumed mean A = 150 and class interval is h = 20.
So, ui = (xi – A)/h = ui = (xi – 150)/20
| Daily wages (Class interval) | Number of workers frequency (fi) | Mid-point (xi) | ui = (xi – 150)/20 | fiui |
| 100-120 | 12 | 110 | -2 | -24 |
| 120-140 | 14 | 130 | -1 | -14 |
| 140-160 | 8 | 150 | 0 | 0 |
| 160-180 | 6 | 170 | 1 | 6 |
| 180-200 | 10 | 190 | 2 | 20 |
| Total | Sum fi = 50 | Sum fiui = -12 |
Mean = x̄ = A + h∑fiui /∑fi =150 + (20 × -12/50) = 150 – 4.8 = 145.20
Thus, mean daily wage = Rs. 145.20
NCERT 10th Maths Chapter 14, class 10 Maths Chapter 14 solutions
3. The following distribution shows the daily pocket allowance of children of a locality. The mean pocket allowance is Rs 18. Find the missing frequency f.

Answer
Here, the value of mid-point (xi) mean x̄ = 18
| Class interval | Number of children (fi) | Mid-point (xi) | fixi |
| 11-13 | 7 | 12 | 84 |
| 13-15 | 6 | 14 | 84 |
| 15-17 | 9 | 16 | 144 |
| 17-19 | 13 | 18 = A | 234 |
| 19-21 | f | 20 | 20f |
| 21-23 | 5 | 22 | 110 |
| 23-25 | 4 | 24 | 96 |
| Total | fi = 44+f | Sum fixi = 752+20f |
Mean = x̄ = ∑fixi /∑fi = (752+20f)/(44+f)
⇒ 18 = (752+20f)/(44+f)
⇒ 18(44+f) = (752+20f)
⇒ 792+18f = 752+20f
⇒ 792+18f = 752+20f
⇒ 792 – 752 = 20f – 18f
⇒ 40 = 2f
⇒ f = 20
4. Thirty women were examined in a hospital by a doctor and the number of heart beats per minute were recorded and summarised as follows. Find the mean heart beats per minute for these women, choosing a suitable method.
Answer
xi = (Upper limit + Lower limit)/2
Class size (h) = 3
Assumed mean (A) = 75.5
| Class Interval | Number of women (fi) | Mid-point (xi) | ui = (xi – 75.5)/h | fiui |
| 65-68 | 2 | 66.5 | -3 | -6 |
| 68-71 | 4 | 69.5 | -2 | -8 |
| 71-74 | 3 | 72.5 | -1 | -3 |
| 74-77 | 8 | 75.5 | 0 | 0 |
| 77-80 | 7 | 78.5 | 1 | 7 |
| 80-83 | 4 | 81.5 | 3 | 8 |
| 83-86 | 2 | 84.5 | 3 | 6 |
| Sum fi= 30 | Sum fiui = 4 |
Mean = x̄ = A + h∑fiui /∑fi = 75.5 + 3×(4/30) = 75.5 + 4/10 = 75.5 + 0.4 = 75.9
The mean heart beats per minute for these women is 75.9
NCERT 10th Maths Chapter 14, class 10 Maths Chapter 14 solutions
5. In a retail market, fruit vendors were selling mangoes kept in packing boxes. These boxes contained varying number of mangoes. The following was the distribution of mangoes according to the number of boxes.

Find the mean number of mangoes kept in a packing box. Which method of finding the mean did you choose?
Answer
Since, the given data is not continuous so we add 0.5 to the upper limit and subtract 0.45 from the lower limit.
Here, assumed mean (A) = 57
Class size (h) = 3
| Class Interval | Number of boxes (fi) | Mid-point (xi) | di = xi – A | fidi |
| 49.5-52.5 | 15 | 51 | -6 | 90 |
| 52.5-55.5 | 110 | 54 | -3 | -330 |
| 55.5-58.5 | 135 | 57 = A | 0 | 0 |
| 58.5-61.5 | 115 | 60 | 3 | 345 |
| 61.5-64.5 | 25 | 63 | 6 | 150 |
| Sum fi = 400 | Sum fidi = 75 |
Mean = x̄ = A + ∑fidi /∑fi = 57 + (75/400) = 57 + 0.1875 = 57.19
6. The table below shows the daily expenditure on food of 25 households in a locality.

Find the mean daily expenditure on food by a suitable method.
Answer
Here, assumed mean (A) = 225
| Class Interval | Number of households (fi) | Mid-point (xi) | di = xi – A | fidi |
| 100-150 | 4 | 125 | -100 | -400 |
| 150-200 | 5 | 175 | -50 | -250 |
| 200-250 | 12 | 225 | 0 | 0 |
| 250-300 | 2 | 275 | 50 | 100 |
| 300-350 | 2 | 325 | 100 | 200 |
| Sum fi = 25 | Sum fidi = -350 |
Mean = x̄ = A + ∑fidi /∑fi = 225 + (-350/25) = 225 – 14 = 211
The mean daily expenditure on food is 211
NCERT 10th Maths Chapter 14, class 10 Maths Chapter 14 solutions
7. To find out the concentration of SO2 in the air (in parts per million, i.e., ppm), the data was collected for 30 localities in a certain city and is presented below:

Find the mean concentration of SO2 in the air.
Answer
| Concentration of SO2 (in ppm) | Frequency (fi) | Mid-point (xi) | fixi |
| 0.00-0.04 | 4 | 0.02 | 0.08 |
| 0.04-0.08 | 9 | 0.06 | 0.54 |
| 0.08-0.12 | 9 | 0.10 | 0.90 |
| 0.12-0.16 | 2 | 0.14 | 0.28 |
| 0.16-0.20 | 4 | 0.18 | 0.72 |
| 0.20-0.24 | 2 | 0.20 | 0.40 |
| Total | Sum fi = 30 | Sum (fixi) = 2.96 |
Mean = x̄ = ∑fixi /∑fi
= 2.96/30 = 0.099 ppm
8. A class teacher has the following absentee record of 40 students of a class for the whole term. Find the mean number of days a student was absent.
| Number of days | 0-6 | 6-10 | 10-14 | 14-20 | 20-28 | 28-38 | 38-40 |
|---|---|---|---|---|---|---|---|
| Number of students | 11 | 10 | 7 | 4 | 4 | 3 | 1 |
Answer
| Class interval | Frequency (fi) | Mid-point (xi) | fixi |
| 0-6 | 11 | 3 | 33 |
| 6-10 | 10 | 8 | 80 |
| 10-14 | 7 | 12 | 84 |
| 14-20 | 4 | 17 | 68 |
| 20-28 | 4 | 24 | 96 |
| 28-38 | 3 | 33 | 99 |
| 38-40 | 1 | 39 | 39 |
| Sum fi = 40 | Sum fixi = 499 |
Mean = x̄ = ∑fixi /∑fi
= 499/40 = 12.48 days
9. The following table gives the literacy rate (in percentage) of 35 cities. Find the mean literacy rate.
| Literacy rate (in %) | 45-55 | 55-65 | 65-75 | 75-85 | 85-98 |
| Number of cities | 3 | 10 | 11 | 8 | 3 |
Answer
| Class Interval | Frequency (fi) | (xi) | di = xi – a | ui = di/h | fiui |
| 45-55 | 3 | 50 | -20 | -2 | -6 |
| 55-65 | 10 | 60 | -10 | -1 | -10 |
| 65-75 | 11 | 70 | 0 | 0 | 0 |
| 75-85 | 8 | 80 | 10 | 1 | 8 |
| 85-95 | 3 | 90 | 20 | 2 | 6 |
| Sum fi = 35 | Sum fiui = -2 |
Mean = x̄ = a + (∑fiui /∑fi) х h
= 70 + (-2/35) х 10 = 69.42
Exercise 14.2
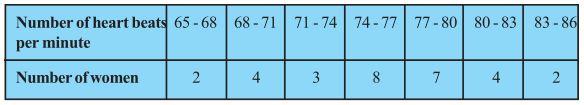
1. The following table shows the ages of the patients admitted in a hospital during a year:
| Age (in years) | 5-15 | 15-25 | 25-35 | 35-45 | 45-55 | 55-65 |
| Number of patients | 6 | 11 | 21 | 23 | 14 | 5 |
Find the mode and the mean of the data given above. Compare and interpret the two measures of central tendency.
Answer
Modal class = 35 – 45, l = 35, class width (h) = 10, fm = 23, f1 = 21 and f2 = 14
Calculation of Mean:
| Class Interval | Frequency (fi) | Mid-point (xi) | fixi |
| 5-15 | 6 | 10 | 60 |
| 15-25 | 11 | 20 | 220 |
| 25-35 | 21 | 30 | 630 |
| 35-45 | 23 | 40 | 920 |
| 45-55 | 14 | 50 | 700 |
| 55-65 | 5 | 60 | 300 |
| Sum fi = 80 | Sum fixi = 2830 |
Mean = x̄ = ∑fixi /∑fi
= 2830/80 = 35.37 yr
NCERT 10th Maths Chapter 14, class 10 Maths Chapter 14 solutions
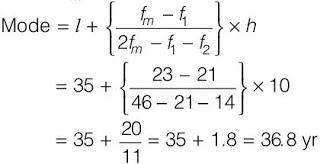
2. The following data gives the information on the observed lifetimes (in hours) of 225 electrical components :
| Lifetime (in hours) | 0-20 | 20-40 | 40-60 | 60-80 | 80-100 | 100-120 |
| Frequency | 10 | 35 | 52 | 61 | 38 | 29 |
Determine the modal lifetimes of the components.
Answer
Modal class of the given data is 60–80.
Modal class = 60-80, l = 60, fm = 61, f1 = 52, f2 = 38 and h = 20
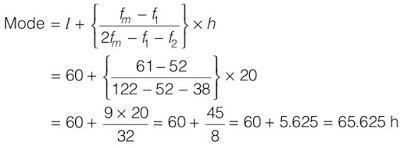
3. The following data gives the distribution of total monthly household expenditure of 200 families of a village. Find the modal monthly expenditure of the families. Also, find the mean monthly expenditure :
| Expenditure | Number of families |
| 1000-1500 | 24 |
| 1500-2000 | 40 |
| 2000-2500 | 33 |
| 2500-3000 | 28 |
| 3000-3500 | 30 |
| 3500-4000 | 22 |
| 4000-4500 | 16 |
| 4500-5000 | 7 |
Answer
Modal class = 1500-2000, l = 1500, fm = 40, f1 = 24, f2 = 33 and h = 500
Calculation for mean:
| Class Interval | fi | xi | di = xi – a | ui = di/h | fiui |
| 1000-1500 | 24 | 1250 | -1500 | -3 | -72 |
| 1500-2000 | 40 | 1750 | -1000 | -2 | -80 |
| 2000-2500 | 33 | 2250 | -500 | -1 | -33 |
| 2500-3000 | 28 | 2750 | 0 | 0 | 0 |
| 3000-3500 | 30 | 3250 | 500 | 1 | 30 |
| 3500-4000 | 22 | 3750 | 1000 | 2 | 44 |
| 4000-4500 | 16 | 4250 | 1500 | 3 | 48 |
| 4500-5000 | 7 | 4750 | 2000 | 4 | 28 |
| fi = 200 | fiui = -35 |
Mean = x̄ = a + (∑fiui /∑fi) х h
= 2750 + (35/200) х 500
= 2750 – 87.50 = 2662.50
NCERT 10th Maths Chapter 14, class 10 Maths Chapter 14 solutions
NCERT Solutions for Maths: Chapter 14: Download PDF
NCERT Solutions for Maths: Chapter 14 – Statistics
Download PDF: NCERT Solutions for Maths: Chapter 14 – Statistics PDF
Chapterwise NCERT Solutions for Class 10 Maths:
- Chapter 1 Real Numbers
- Chapter 2 Polynomials
- Chapter 3 Pair of Linear Equations in Two Variables
- Chapter 4 Quadratic Equations
- Chapter 5 Arithmetic Progressions
- Chapter 6 Triangles
- Chapter 7 Coordinate Geometry
- Chapter 8 Introduction to Trigonometry
- Chapter 9 Applications of Trigonometry
- Chapter 10 Circle
- Chapter 11 Constructions
- Chapter 12 Areas related to Circles
- Chapter 13 Surface Areas and Volumes
- Chapter 14 Statistics
- Chapter 15 Probability
About NCERT
The National Council of Educational Research and Training is an autonomous organization of the Government of India which was established in 1961 as a literary, scientific, and charitable Society under the Societies Registration Act. Its headquarters are located at Sri Aurbindo Marg in New Delhi. Visit the Official NCERT website to learn more.