
[mathjax]
Question 1
The following distribution gives the daily income of 50 workers of a factory:
| Daily income (in Rs) | 100-120 | 120-140 | 140-160 | 160-180 | 180-200 |
| Number of workers | 12 | 14 | 8 | 6 | 10 |
Convert the distribution above to a less than type cumulative frequency distribution, and draw its ogive.
Sol :
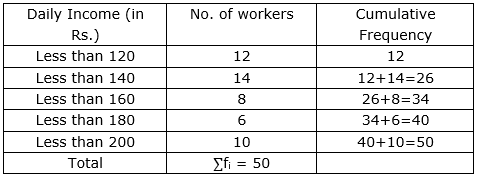
Now, taking upper class limits on x- axis and their respective frequencies on y-axis we can draw its ogive as follows: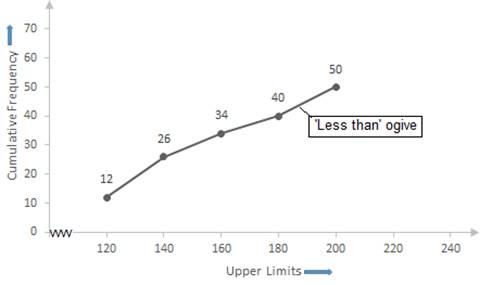
Question 2
Draw 'more than' ogive of the following distribution:
Sol :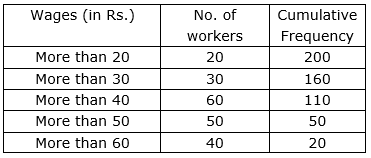
Now, taking lower class limits on x- axis and their respective frequencies on y-axis we can draw its ogive as follows:
Question 3
Draw a less than type cumulative frequency curve for the following data and from the graph find the median:
Sol :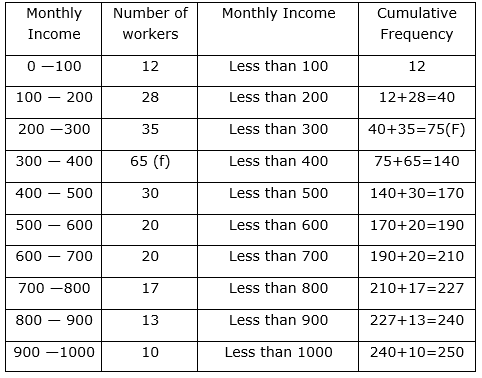
Now, taking upper class limits on x- axis and their respective frequencies on y-axis we can draw its ogive as follows: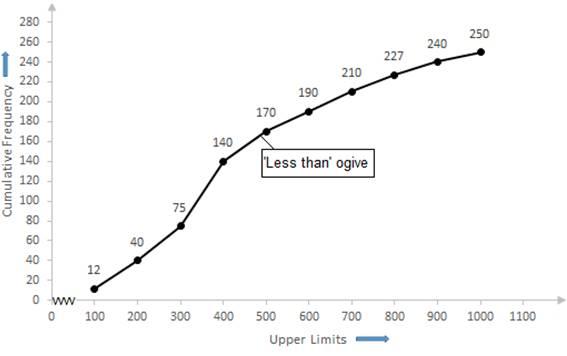
Now, we have n = 250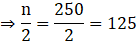
The cumulative Frequency just greater than  is 140 then the median class is 300-400 such that
the lower limit (l) = 300
cumulative frequency of the class preceding 300-400 (cf) = 75
frequency of the median class 300-400 = 65,
class size (h) = 100
Using the formula,Median =1+n2−cff×h,we have
Median =300+125−7565×100
= 300 +76.9
= 376.9
=377 (approx.)
Question 4
Convert the following distribution into 'more than' frequency distribution and draw more than' ogive. Also find the median from it.
Sol :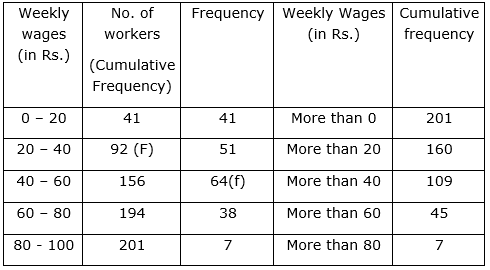
Now, taking lower class limits on x-axis and their respective frequencies on y-axis we can draw its ogive as follows: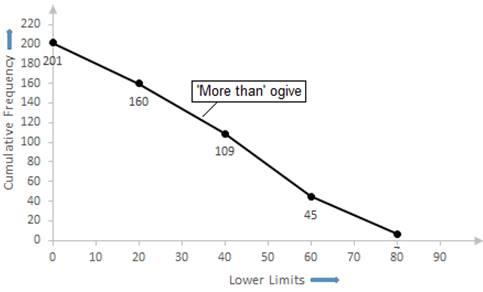
Now, we have n = 201
⇒n2=2012=100.5
The cumulative Frequency just greater than n2 is 156 then the median class is 40 – 60 such that
the lower limit (l) = 40
cumulative frequency of the class preceding 40 - 60 (cf) = 92
frequency of the median class 40-60 = 64,
class size (h) = 20
Using the formula, Median =1+n2−cff×h, we have
Median =40+100.5−9264×20
= 40 +2.65
= 42.65
= 42.7
Question 5
The annual profits earned by 30 shops of a shopping complex in a locality give the following distribution:
Draw both ogives for the data given above and hence obtain the median profit.
Sol :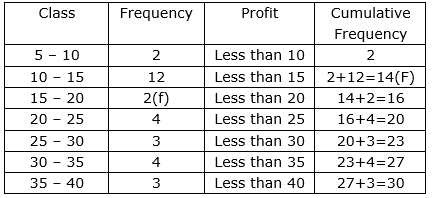
Now, taking upper-class limits on x-axis and their respective frequencies on y-axis we can draw its ogive as follows: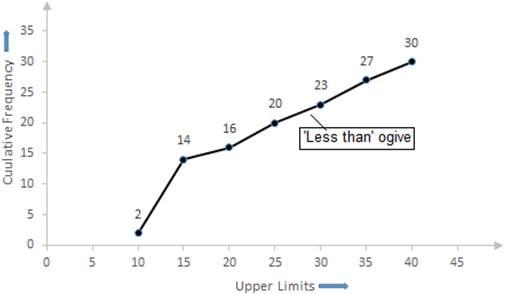
Now, we have n = 30
⇒n2=302=15
The cumulative Frequency just greater than n2 is 16 then the median class is 15 – 20 such that
the lower limit (l) = 15
cumulative frequency of the class preceding 15 – 20 (cf) = 14
the frequency of the median class 15 – 20 = 2,
class size (h) = 5
Using the formula, Median =1+n2−cff×h, we have
Median =15+15−142×5
= 15 + 2.5
= 17.5
So, the median profit is Rs. 17.5
Question 6
The following table gives the distribution of the monthly income of 600 families in a certain city:
Draw a 'less than' and 'more than' ogive curve for the above data on the same graph and from these find the median.
Sol :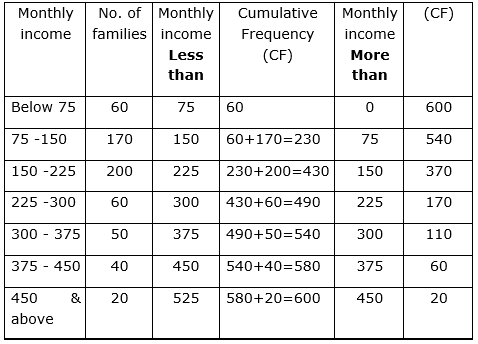
Now, taking monthly income on x-axis and their respective frequencies on y-axis we can draw its ogive as follows:
Now, we have n = 600
⇒n2=6002=300
The cumulative Frequency just greater than n2 is 430 then the median class is 150 – 225 such that
the lower limit (l) = 150
cumulative frequency of the class preceding 150 – 225 (cf) = 230
frequency of the median class 150 – 225 = 200,
class size (h) = 75
Using the formula,Median =1+n2−cff×h,we have
Median =150+300−230200×75
=150+70200×75
= 150 +26.25
= 176.25
= 176(approx.)