NCERT Exemplar Class 8 Maths Chapter 2: Data Handling. NCERT Exemplar Solutions for Class 8 Maths Chapter 2 Data Handling prepare students for their Class 8 exams thoroughly.
Maths problems and solutions for the Class 8 pdf are provided here which are similar to the questions being asked in the previous year’s board.
Contents
NCERT Exemplar Class 8 Maths Chapter 2: Data Handling
Class 8: Maths Chapter 2 solutions. Complete Class 8 Maths Chapter 2 Notes.
Main Concepts and Results
- The information collected in term of numbers is called data.
- Data are represented graphically to have a quick glance on them.
- Data available in an unorganised form are called raw data.
- The number of times a particular observation occurs in a given data is called its frequency.
- When the data are large, they can be arranged in groups and each group is known as Class Interval or Class.
- A table showing the frequencies of various observations or class intervals of a given data is called a Frequency Distribution table.
- The upper value of a class interval is called its Upper Class Limit and the lower value of the class interval is called its Lower Class Limit
- The difference between the upper class limit and lower class limit of a class is called the Width or Size of the class.
- The difference between the lowest and the highest observation in a given data is called its Range.
- Grouped data can be represented by a histogram
- Histogram is a type of bar diagram, where the class intervals are shown on the horizontal axis and the heights of the bars (rectangles) show the frequency of the class interval, but there is no gap between the bars as there is no gap between the class intervals
- Data can also be represented using a pie chart (circle graph). It shows the relationship between a whole and its parts.
- There are certain experiments whose outcomes have an equal chance of occurring. Such outcomes are said to be equally likely.
- Probability of an event =
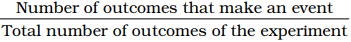
, when the outcomes are equally likely.
Solved Examples
Example 1: The range of the data– 9, 8, 4, 3, 2, 1, 6, 4, 8, 10, 12, 15, 4, 3 is (a) 15 (b) 14 (c) 12 (d) 10
Solution: The correct answer is (b).
Example 2: The following data : 2, 5, 15, 25, 20, 12, 8, 7, 6, 16, 21, 17, 30, 32, 23, 40, 51, 15, 2, 9, 57, 19, 25is grouped in the classes 0 –5, 5 –10, 10 –15 etc. Find the frequency of the class 20 –25.
Solution: The correct answer is (c).
Example 3: The pie chart depicts the information of viewers watching different type of channels on TV. Which type of programmes are viewed the most?
(a) News (b) Sports (c) Entertainment (d) Informative.
Solution: The correct answer is (c).
Example 4:
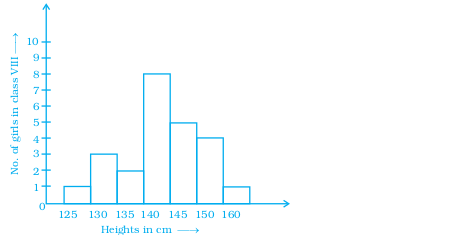
Observe the histogram given above. The number of girls having height 145 cm and above is (a) 5 (b) 10 (c) 17 (d) 19
Solution: The correct answer is (b).
Example 5: A dice is thrown two times and sum of the numbers appearing on the dice are noted. The number of possible outcomes is (a) 6 (b) 11 (c) 18 (d) 36
Solution: The correct answer is (b). [Possible sums are 2, 3, 4, 5, 6, 7, 8, 9, 10, 11, 12].
Example 6: The probability of getting a multiple of 2 when a dice is rolled is

Solution: The correct answer is (c).
Fill in the Blanks Solved Examples
Example 7: The fourth class interval for a grouped data whose first and second class intervals are 10 –15 and 15 –20 respectively is __________.
Solution: 25 – 30
Example 8: In the class interval 250 – 275, 250 is known as the _________.
Solution: Lower class limit.
Example 9: The number of times a particular observation occurs in the given data is called its __________.
Solution: Frequency.
Statements are true (T) or false (F).
Example 10: The central angle of the sectors in a pie chart will be a fraction of 360°.
Solution: True.
Example 11: On throwing a dice, the probability of occurrence of an odd number is 1/2.
Solution: True.
Example 12: A pie chart is also called a pictograph.
Solution: False.
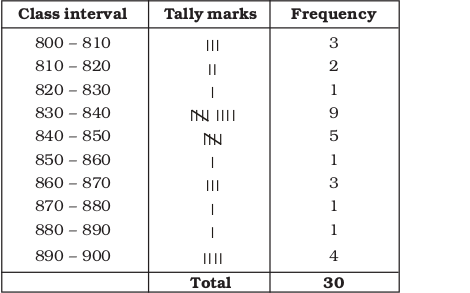
Example 13: The weekly wages (in Rs.) of 30 workers in a factory are 830, 835, 890, 810, 835, 836, 869, 845, 898, 890, 820, 860, 832, 833, 855, 845, 804, 808, 812, 840, 885, 835, 835, 836, 878, 840, 868, 890, 806, 840. Using tally marks, make a frequency distribution table
with class intervals 800 – 810, 810 – 820 and so on.
Solution:
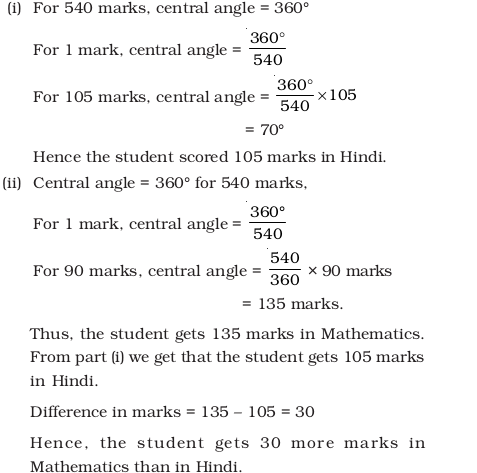
Example 14: The pie chart gives the marks scored in an examination by a student in different subjects. If the total marks obtained were 540, answer the following questions–
(i) In which subject did the student score 105
(ii) How many more marks were obtained by the student in Mathematics than in Hindi?

Solution:
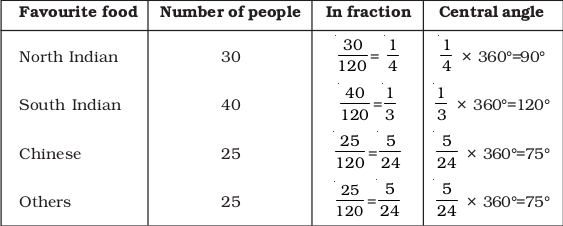
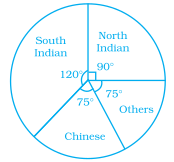
Example 15: Draw a pie chart for the given data.
| Favourite food | Number of people |
| North Indian | 30 |
| South Indian | 40 |
| Chinese | 25 |
| Others | 25 |
Solution: Total number of people = 120
We find the central angle for each sector

Example 16: Draw a histogram for the frequency distribution table
given in Example 13 and answer the following questions.
(i) Which class interval has the maximum number of workers?
(ii) How many workers earn Rs. 850 and more?
(iii) How many workers earn less than Rs. 850?
(iv) How many workers earn Rs. 820 or more but less than Rs. 880?
Solution:

(i) 830 – 840
(ii) 10
(iii) 20
(iv) 20
Example 17: Read the frequency distribution table given below and answer the questions that follow:
| Class Interval | Frequency |
| 25 – 35 | 1 |
| 35-45 | 5 |
| 45-55 | 5 |
| 55-65 | 4 |
| 65-75 | 0 |
| 75-85 | 8 |
| 85-95 | 2 |
| Total | 25 |
(i) Class interval which has the lowest frequency.
(ii) Class interval which has the highest frequency.
(iii) What is the class size of the intervals?
(iv) What is the upper limit of the fifth class?
(v) What is the lower limit of the last class?
Solution: (i) 65 – 75
(ii) 75 – 85
(iii) 10
(iv) 75
(v) 85
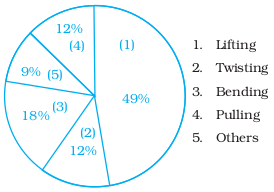
Example 18: Application on problem solving strategy
Given below is a pie chart depicting the reason given by people who had injured their lower back. Study the pie chart and find the number of people who injured their back while either bending and lifting. A total of 600 people were surveyed.
Solution: Understand and explore the problem
- What information is given in the question? The percentages of the most common reasons given by 600 people.
- What are you trying to find? The total number of people out of 600 who have injured their back while bending and lifting.
- Is there any information that is not needed? The percentages of other reasons except bending and lifting are not required.
Plan a strategy
- You have learnt to solve questions dealing with percentages in earlier classes. Use the same method to solve this question.
- 18% have injured their back while bending and 49% have injured their back while lifting so–
To find
The total number of people can be found by finding (18% + 49%) = 67% of 600.
Solve
Total percentage of people who injured their back while bending and lifting = 18% +49% = 67%. Number of people who injured their back while bending and lifting = 67% of 600

Hence, 402 people injured their back while bending and lifting
Revise
You can check the answer by finding the total number of people who injured their backs for reasons other than bending and lifting and then subtracting the answer from the total number of people.
Total percentage of people who injured their backs for
reasons other than bending and lifting = 12% +12% + 9%
= 33%
Number of such people = 33% of 600= 33/100 x 600
So, 600 –198 should give us the answer for our original question, and 600 –198 = 402 which is same as our answer. Hence our answer is correct.
Multiple Choice Questions
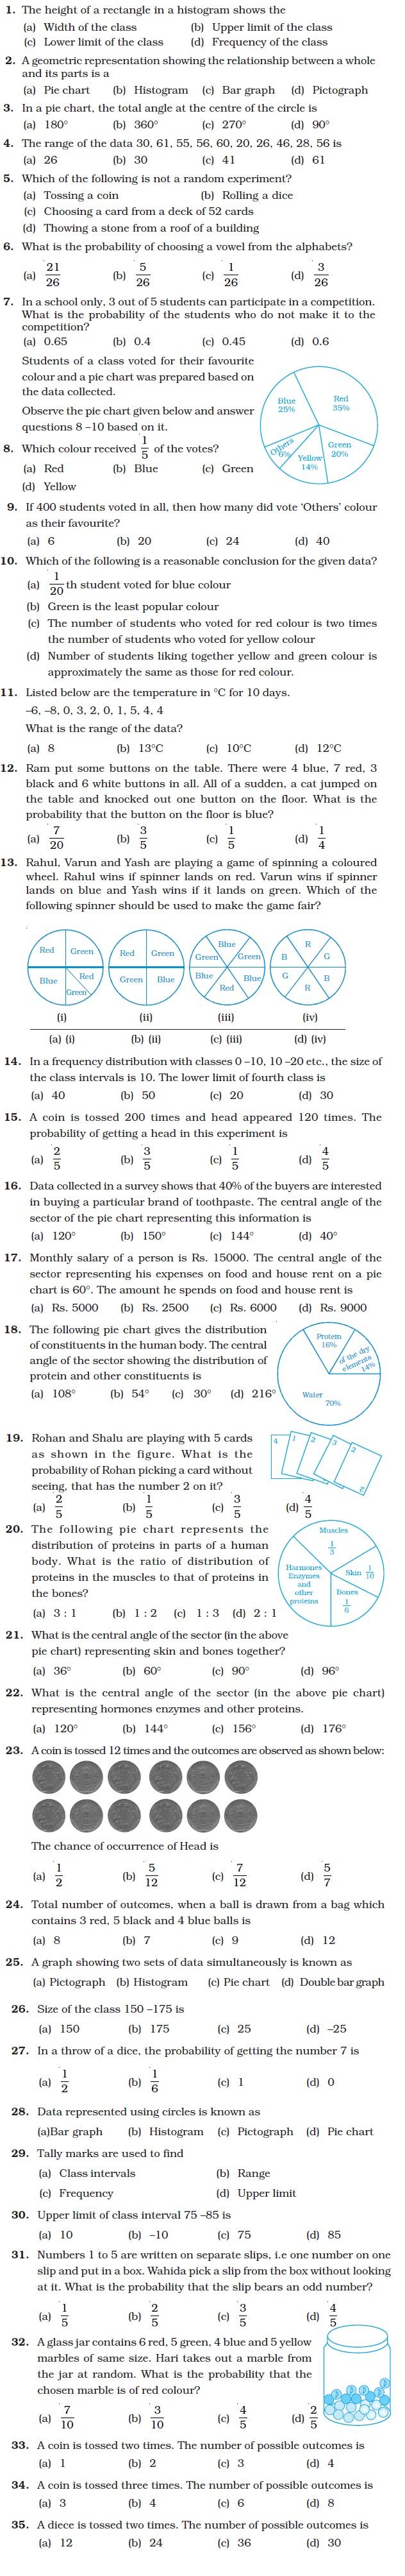
Fill in the Blanks Type Questions

True False Type Questions
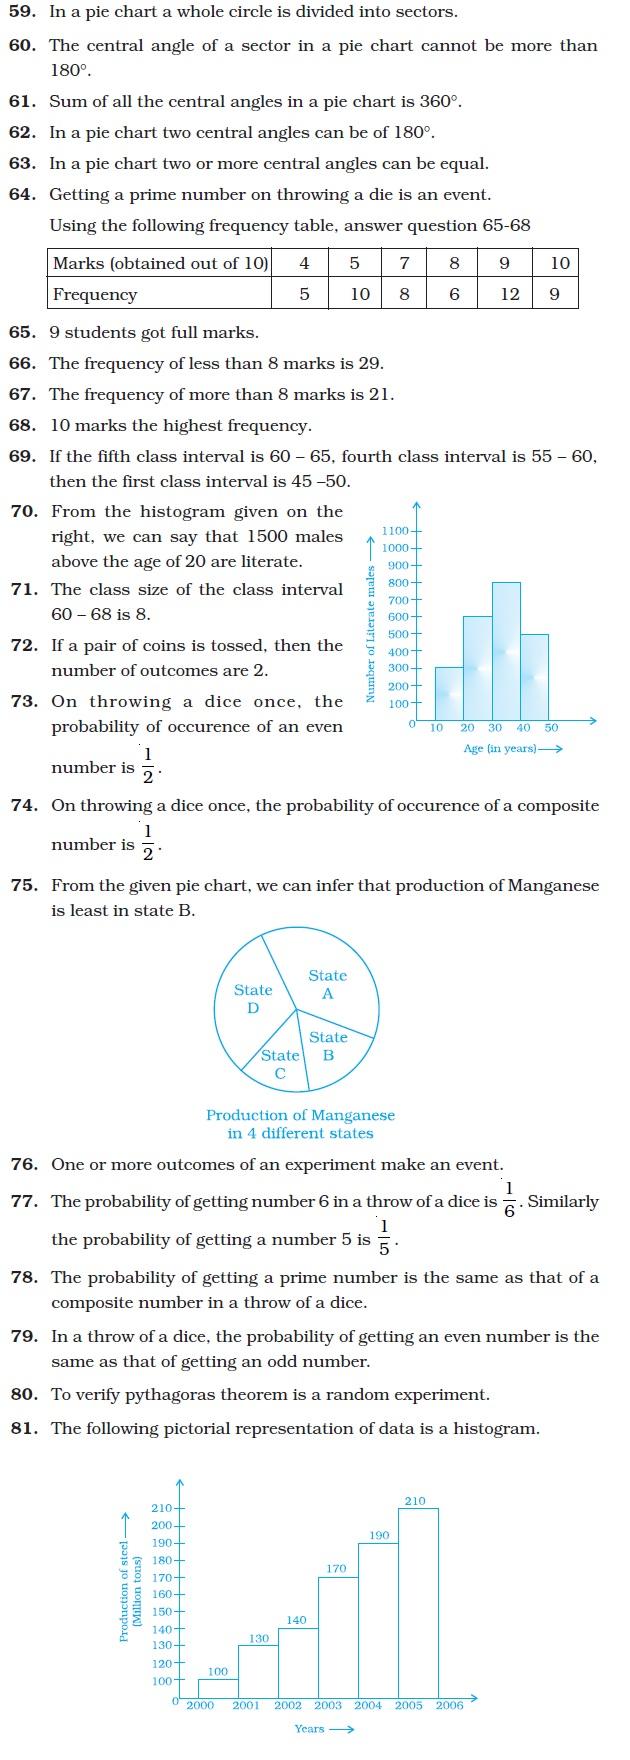
Short Answer Type Questions

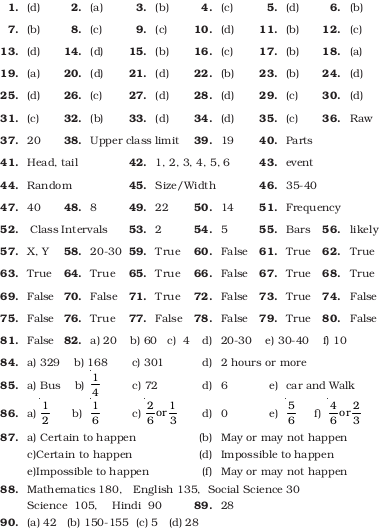
Answers to Multiple Choice Questions