NCERT Exemplar Class 8 Maths Chapter 12: Introduction to Graphs. NCERT Exemplar Solutions for Class 8 Maths Chapter 12: Introduction to Graphs prepare students for their Class 8 exams thoroughly.
Maths problems and solutions for the Class 8 pdf are provided here which are similar to the questions being asked in the previous year’s board.
Contents
NCERT Exemplar Class 8 Maths Chapter 12: Introduction to Graphs
Main Concepts and Results
- Graphical representation of data is easier to understand
- A bar graph, a pie chart and histogram are graphical representations of data.
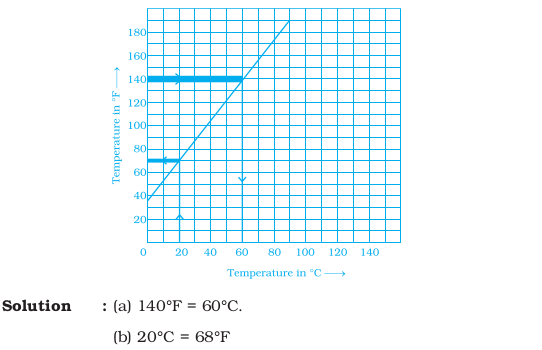
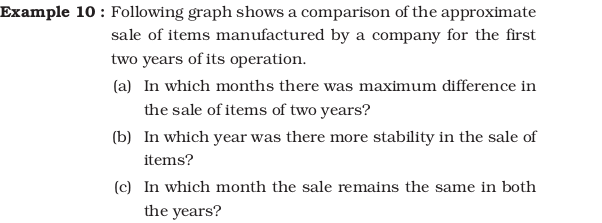
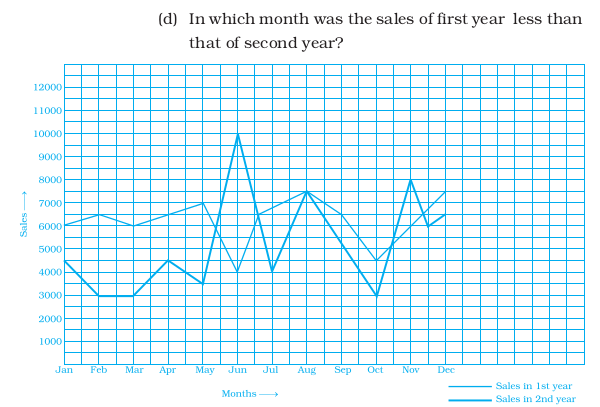
- A line graph displays data that changes continuously over periods of time.
- A line graph in which all the line segments form a part of a single line is called a linear graph.
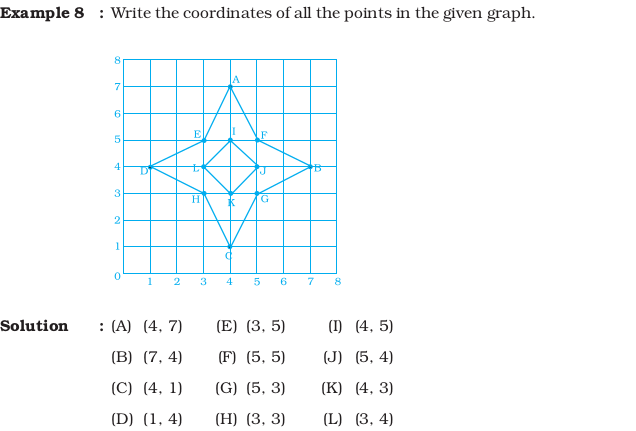
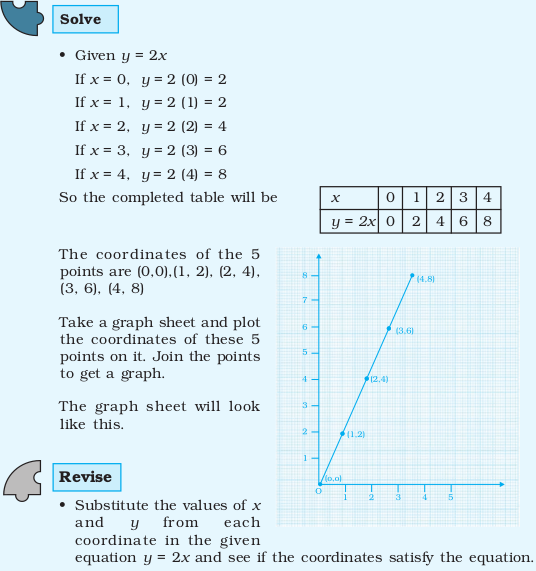
- For fixing a point on the graph sheet, we need two mutually perpendicular lines (in which horizontal line is called x axis and the vertical line as y axis) along with, x coordinate (abscissa) and y coordinate (ordinate) of the point. The process of fixing a point with the help of the coordinates is known as plotting a point in the plane.
- The relation between a dependent variable and an independent variable is shown through a graph.
Solved Examples
In examples 1 and 2, there are four options out of which one is correct.
Write the correct answer.


In examples 3 and 4, fill in the blanks to make the statements true.

In examples 5 and 6, state whether the statements are true (T) or false (F).







Multiple Choice Questions

Fill in the Blanks Type Questions

True False Type Questions

Short Answer Type Questions


Answers to Multiple Choice Questions

